Andrew F. Haughwout, Donghoon Lee, Joseph Tracy, and Wilbert van der Klaauw
The recent financial crisis—the worst in eighty years—had its origins in the enormous increase and subsequent collapse in housing prices during the 2000s. While the housing bubble has been the subject of intense public debate and research, no single answer has emerged to explain why prices rose so fast and fell so precipitously. In this post, we present new findings from our recent New York Fed study that uses unique data to suggest that real estate “investors”—borrowers who use financial leverage in the form of mortgage credit to purchase multiple residential properties—played a previously unrecognized, but very important, role. These investors likely helped push prices up during 2004-06; but when prices turned down in early 2006, they defaulted in large numbers and thereby contributed importantly to the intensity of the housing cycle’s downward leg.
Investors in the Housing and Mortgage Markets
Virtually everyone who buys a house is hoping for prices to rise, and most use leverage (debt)—in this case, a mortgage—to allow them to buy more housing than they can afford to pay for in cash. While the majority of borrowers have a consumption motive—as “owner-occupants,” they intend to live in the house—some borrowers own housing purely as an investment. As mortgage lenders have long known, investors are more likely than owner-occupants to walk away from an underwater property. So when a borrower acknowledges on the mortgage application that she won’t live in the house, the lender will typically require a higher down-payment and charge a higher interest rate to reflect the additional default risk. Within the category of real estate investors, some buy properties with the intention of renting them out, while others intend to simply “flip this house,” selling quickly and reaping a capital gain.
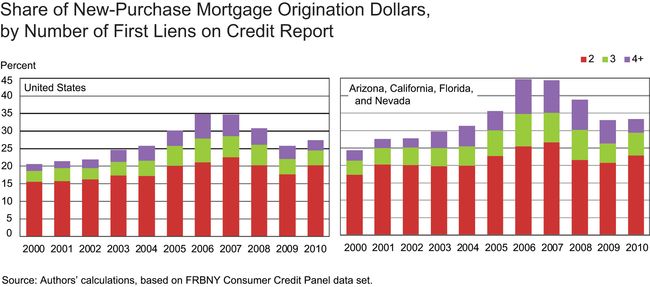
The charts below show the shares of new-purchase mortgage debt going to investors with multiple first-lien mortgages on their credit reports, as reported in the FRBNY Consumer Credit Panel (CCP). Since each property can have just one first lien—the primary mortgage—the number of first liens reflects the minimum number of properties a borrower owns (“minimum” because people can of course own houses free and clear). In the charts, the colors of the bars indicate how many properties the borrower owns after taking out this new-purchase mortgage debt; we show data for the country as a whole on the left and for four states that experienced especially pronounced housing cycles—Arizona, California, Florida, and Nevada—on the right.
The charts reveal some astonishing facts. At the peak of the boom in 2006, over a third of all U.S. home purchase lending was made to people who already owned at least one house. In the four states with the most pronounced housing cycles, the investor share was nearly half—45 percent. Investor shares roughly doubled between 2000 and 2006. While some of these loans went to borrowers with “just” two homes, the increase in percentage terms is largest among those owning three or more properties. In 2006, Arizona, California, Florida, and Nevada investors owning three or more properties were responsible for nearly 20 percent of originations, almost triple their share in 2000.
Investors Are Different from Owner-Occupants
Whether they were buying vacation homes or flipping houses, real estate investors behaved very differently from borrowers with just one first lien, a group almost certainly dominated by owner-occupants. For one thing, investors are very unlikely to move to the house they bought, especially if they own three or more properties. In rising markets, “buy-and-flip” investors typically want to hold properties for relatively short periods, and we show in our study that multiple-property owners in the mid-2000s tended to sell their properties much more quickly than those with just one first-lien mortgage. Importantly, we also show how buy-and-flip investors can make higher bids on houses, even if they had relatively little cash, by using low-down-payment loans. Nonprime credit—mortgage lending to borrowers who were unable or unwilling to qualify for cheaper, prime loans—enabled optimistic investors to speculate by making highly leveraged bets on house prices.
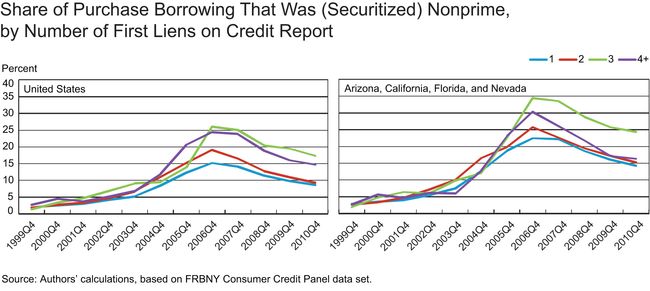
Because investors don’t plan to own properties for long, they care much more about reducing their down-payments than reducing their interest rates. The expansion of the nonprime mortgage market during the 2000s provided the perfect opportunity for optimistic investors to get low-down-payment credit, albeit at high interest rates. As shown in the charts below, investors were far more likely than owner-occupants to use nonprime credit to make their purchases, especially at the peak. Again, the colors show the number of properties the borrower owns, but this time we leave in the single-property borrowers for comparison.
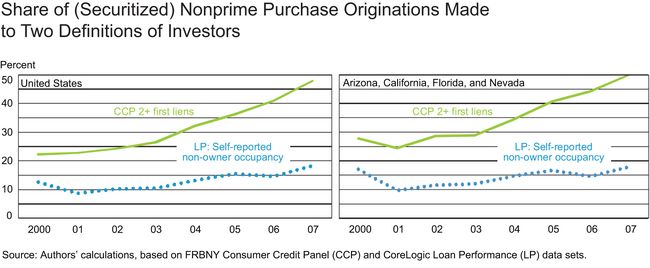
We created these charts by matching our CCP sample (which is based on Equifax credit reports) with data from CoreLogic’s Loan Performance data set of securitized nonprime mortgage loans. An additional benefit of this matched sample is that it helps to explain why we are among the first to notice the importance of investors in the mortgage market during the 2000s. The next two charts report shares of mortgage lending using two distinct measures of investor status. The first measure, shown by the dashed lines, is what’s reported in the Loan Performance data: whether the borrower self-reported to the lender that she wouldn’t be an owner-occupant. The second measure, represented by the solid lines, is our preferred measure from the CCP: Does the borrower own more than one house when this purchase is complete? In the crucial nonprime sector, the share of borrowers who acknowledged their investor status was relatively low and constant—less than 20 percent throughout the boom. But by our definition, at the peak the investor share in this market was more than double the self-reported rate.
Did It Matter in the Bust?
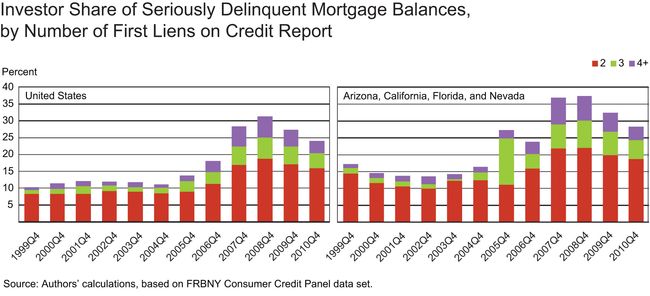
So far, we have half the story: Optimistic investors—speculators—used low-down-payment, nonprime credit to place highly leveraged bets on the housing market, perhaps facilitated for some by reporting an intention to live in the house. Because they didn’t have to put much money at risk, these investors were able to continue to buy housing even as prices rose further. All of these developments were especially noticeable in Arizona, California, Florida, and Nevada. Longstanding tradition in the mortgage lending business and the predictions of economic models hold that investors will quickly default if prices begin a persistent fall. This is what happened starting in 2006, as the charts below show.
An interesting feature that’s hard to see here but that we document in our study is that borrowers with multiple mortgages start out being better risks—their loans were less likely to become seriously delinquent before 2006—but end up accounting for a disproportionate amount of defaults thereafter. What changed in 2006? Prices started to fall. In 2007-09, investors were responsible for more than a quarter of seriously delinquent mortgage balances nationwide, and more than a third in Arizona, California, Florida, and Nevada. While this sharp change in the risk assessment of owners of three or more properties may not seem surprising, it also applied to investors with “just” two homes. If there were reason to believe this latter group was less prone to act like investors, the data don’t support this view.
Lessons to Learn?
We conclude that investors were much more important in the housing boom and bust during the 2000s than previously thought. The availability of low- and no-down-payment mortgages in the nonprime sector enabled investors to make these bets. This may have allowed the bubble to inflate further, which caused millions of owner-occupants to pay more if they wanted to buy a home for their family. In the end, even the value of the 20 percent down-payments made by responsible, prime borrowers was wiped out—leaving the housing market, and the economy, in the vulnerable state we find them in today.
The idea that asset price booms may be driven by optimistic or speculative investors who make highly leveraged bets on asset prices, then quickly default if their expectations are not realized, is not new. Indeed, John Geneakoplos of Yale University argues that such behavior is a fundamental driver of what he calls the “leverage cycle.” To our knowledge, our study provides the first direct evidence that such behavior may have been important in the 2000s housing cycle.
But what, if anything, does it teach us about policy? We conclude that it’s very important for lenders (and regulators) to manage leverage as asset bubbles are inflating. In the 2000s, securitized nonprime credit emerged to allow leverage to increase, with effects that extended far beyond this sector, including spillovers from defaulted mortgages to the value of other properties (see Campbell, Giglio, and Pathak [2009]). Effective regulation of speculative borrowing, like what is being attempted in China today, may be needed to prevent this kind of crisis from recurring.
Disclaimer
The views expressed in this blog are those of the authors and do not necessarily reflect the position of the Federal Reserve Bank of New York, or the Federal Reserve System. Any errors or omissions are the responsibility of the authors.


 RSS Feed
 Follow Liberty Street Economics
This article reminded us of what happened at the beginning of the credit crunch. It also shows us that few lessons should be learnt by owner-occupants and property investors.
Yes, investors played a role. No question about it. And investors are playing a role in the recovery now as well. Buying up inventory of homes that are coming out of foreclosure. While investors surely did take advantage of weak lending guidelines, I think real estate investors are more than a group of financial predators. I think we would be in a much deeper mess now if it were not for investors, big and small, who have gotten back into the market and taken inventory levels down over the past 12-18 months. Although Texas, and Austin Texas in particular, played almost no role in either the boom or the bust, investors have returned to the Austin area as prices bottomed out and are now moving ahead of prices of our 2007 peaks. Austin was only mildly hit compared to the rest of the nation, but from peak to bottom was still a greater fall than we wanted to experience. The investors who returned to our area have helped stabilize the market for everyone. F
Thanks to our readers for many thoughtful comments, and sorry for the delayed response. Of course, we aren’t the first to suspect investor activity, as the title of our post – referencing the long-running TV show – indicates. We also know that some agencies (http://www.fincen.gov/news_room/rp/reports/pdf/MortgageLoanFraud.pdf) and industry observers (http://www.calculatedriskblog.com/2005/04/housing-speculation-is-key.html) had noted behavior like this, but most research studies have to rely on self-reported investor status, which showed only modest increases in investor activity. Our credit report data set now allows us to monitor and analyze developments like this more comprehensively. We agree with Robert Weiler’s response to VS – the investors we identify were more likely than owner-occupants to use nonprime credit to finance their purchases. Jason points to low interest rates as a key factor in allowing this behavior, but in our paper we argue that if they plan to hold for a short period, investors will prefer low down-payments to low interest rates. So we continue to think that monitoring combined loan value is important, regardless of the interest rate environment. With respect to Robert Sherman’s question about government programs, we agree that it is important for assistance to be targeted to owner-occupants, as is currently required by both HAMP and HARP (http://www.makinghomeaffordable.gov/faqs/homeowner-faqs/Pages/default.aspx). Answers to a few somewhat technical questions about our analysis: 1. Our investor definition includes borrowers who have two mortgages for periods exceeding six months, and would thus include buyers of vacation homes. Vacation homes are admittedly a “gray area,” since they almost certainly provide some consumption benefits to their owners. But they were not the fastest growing part of the investor population, and the same patterns hold when we focus just on 3+ first-lien borrowers. 2. We don’t have direct evidence of occupancy misreporting beyond what we present in the paper. 3. In the paper, we present evidence that controls for vintage and other variables in case other readers are interested.
Here’s a thought. Let the market forces drive the economy, and tell government get the hell out of the way! Come on folks. Only, we, the people, are solely responsible for our economic future and until we all stop trying to blame the “other guy” it won’t get better. Be a shepherd, not a sheep.
Investors could not have done any of this had it not been for cheap interest rates from the Federal Reserve, Congress’ expanded loan programs from Fannie and Freddie to put everyone in their own home, mortgage securitization, fiat currency, and central banking. The authors are trying to claim that a symptom of the Fed’s monetary policy is the cause of the housing crisis. This is akin to claiming that wet streets cause rain. The Fed’s foolish monetary policy is to blame for this housing crisis. If cheap credit had not been available, flipping houses would not have been nearly as profitable.
Getting half way there; short speculation with leverage contributed yes, but leverage is still there and now the speculation is long, thanks to taxpayer backing while prices are “asked” for and loaned against as if the stock has infinite shelf life and without costs. Neither is true of course, as both blight and losses continue to expose. So why this much friction? Subsidy and un-intended consequences remain part of the problem being exasperated by “management” of value. But with ever more bank and fed owned properties we’re choosing darkness and waste over transparency and efficiency by not utilizing modern, retail auctions, especially pre-foreclosure for liquidation and workout. To protect housing industry middleman and too big to fail institutions out of systemic fear is clear, but the losses being widened to avoid beneficial change is now itself, the worst kind of fate, the rot from within. There are still buyers, and therefore time, to let the sun shine in on better net values for both sellers, taxpayers and buyers but for more openly competitive, definite and quick local sales to the highest and best bidders. This might displace vacant asset level management and the cronyism attendant thereto as unneeded, but we’d gain stewardship, balance and confidence.
“Effective regulation of speculative borrowing”? Hello? Are you serious? There is NO speculative borrowing unless there is speculative lending. If a bank gives blank “create your own loan” checks to everyone in community, do you think a bubble would appear? Hello?
It has been said that as many as 40% of people who purchased their first property in the years proceeding the credit crunch would not have been able to do so at all under post credit crunch lending conditions.
VS answers his own question; for the most part, the type of loans described here would not be insured or purchased by Fannie or Freddie, therefore it follows that if the boom was speculator driven, Fannie, Freddie, and especially the CRA had little if anything to do with it. Unfortunately this apparently contradicts his prior conclusion that Fannie and Freddie must be at fault, therefore, he concludes the speculator driven boom theory must be wrong regardless of what the data is telling us. A 2nd home that isn’t purchased as a rental property seems to me to be entirely a speculative investment. It doesn’t generate revenue and it seems unlikely that it provides the owner satisfaction of their desires equal to the cost. The purchaser is making at bet that they at least won’t lose money when they eventually sell and thus whatever pleasure they get from their second home is a ‘bonus’. (speaking as someone with a 2nd home which has turned out to be a fairly expensive indulgence).
I’m dismayed by the attempts to spin the financial meltdown on a bunch of relatively poor people, who were allegedly irresponsible in taking out loans that they couldn’t afford, with the banks making the loans only because of knives held to their throats by Clinton, Frank, Fannie, and Freddie. I think it’s obvious that the problem was a capital glut (exacerbated by the Bush tax cuts), combined with historically low T bill rates (misguided Fed/Greenspan policy), leaving a worldwide ocean of capital, with no place to go. This huge demand for safe yields, above those of T bills, created a booming business for loan salespeople working on commissions, for appraisers wanting to please the loan salespeople, for bank managers trying to earn bonuses, and for high end Wall Street securities brokers. This gave the “flippers” all the capital they needed to help destroy the housing market and, with it, the economy.
Thanks for the great comments, and keep them coming. We will reply following the FOMC meeting, on Friday, December 16th.
I am not sure this analysis is correct. 20% of homes are bought by investors in normal times and about 13% increase in 2006. So of all the total purchases only 13% increase is by investors. so all defaults were due to this 13% investors. How come Fannie and Freddie was able to gurantee loans, I thought the minimum was 20% down payment required. I think the role of Fannie and Freddie Mac is downplayed, when infact they are root cause of the crises.
Seriously: 2005. http://www2.citypaper.com/story.asp?id=10358 Anyone who was paying any attention knew by then what was about to happen, and why. By ’08 the aftermath was already smoldering: http://www2.citypaper.com/eat/story.asp?id=16788 Yet the games continued: http://www2.citypaper.com/eat/story.asp?id=18359 As they do today. Where y’all been?
This article should be dated Dec 5, 2009 because that’s how long we’ve known this. All I can say is “duh!”.
No one forced the banks to loan to investors. The banks knew the risks and made the loans anyway. Let the banks pay for their own mistakes…..
I have two words for you: Casey Serin If those don’t mean anything, please read this: http://en.wikipedia.org/wiki/Casey_Serin and more importantly, this: http://iamfacingforeclosure.com/oldsite/33/will-i-go-to-jail-for-mortgage-fraud.html The evidence that this type of investor behavior was rampant (and would end in tears) was pitifully easy to find in 2005 and 2006. It took precious little Google searching to turn up this kind of behavior during that period, and the extent of it and the terms on which credit was being extended should have been a “firebell in the night” for the regulatory community. I commend the NY Fed for publicly posting this information and do hope that it inspires some soul searching with the fortres on Liberty Street as to just what was going on with the credit regulation function between 2004 and 2006. I repeat this type of information was not hard to find and the notion that huge risks were being taken with little skin in the game was evident to quite a few people. The reaction to this report from most of us who were paying attention in 2005 and 2006 will be: “Duh! What do you expect, you are surprised by this?” The staff of the NY Fed should ask itself why someone wasn’t doing this analysis 6 years ago. Lastly, the quality of the analysis could be improved by looking at defaults on a vintage year basis rather than simplistically using the time at which they defaulted. Would yield better insight into borrower behavior.
Is there any data on fraud in the sense that people who fraudulently got loans as being “Owner Occupied” but then turned out renting them out?
How do you separate out families that are moving (and would presumably self-report their intention to occupy the new home) but have not yet closed on the sale of their old home (which would presumably still be on their credit report)?”
It seems more likely that most of the “2” category are second homes rather than speculative investments.
So why is the President and Fed burning through so many taxpayer dollars bailing them out? This if the dumbest the govt has ever been.