M. Henry Linder, Richard Peach, and Robert W. Rich
How tight is the labor market? The unemployment rate is down substantially from its October 2009 peak, but two-thirds of the decline is due to people dropping out of the labor force. In addition, an unusually large share of the unemployed has been out of work for twenty-seven weeks or more—the long-duration unemployed. These statistics suggest that there remains a great deal of slack in U.S. labor markets, which should be putting downward pressure on labor compensation. Instead, compensation growth has moved modestly higher since 2009. A potential explanation is that the long-duration unemployed exert less influence on wages than the short-duration unemployed, a hypothesis we examine here. While preliminary, our findings provide some support for this hypothesis and show that models taking into account unemployment duration produce more accurate forecasts of compensation growth.
The hypothesis that individuals who are unemployed for long durations have less impact on the behavior of wages than the recently unemployed is not new. Insider-outsider models make this prediction, and a paper by Ricardo Llaudes finds strong support for this proposed explanation in data for European countries. What is new is the relevance of this hypothesis for movements in wage rates in the United States. In particular, conventional models—such as Phillips curve models—have generally underpredicted compensation growth since 2009. These models typically rely on the total unemployment rate as the measure of labor market tightness. If the long-duration unemployment rate has limited impact on the compensation growth process, then its relatively large share in the unemployment rate in recent years could account for the underprediction of standard Phillips curve models.
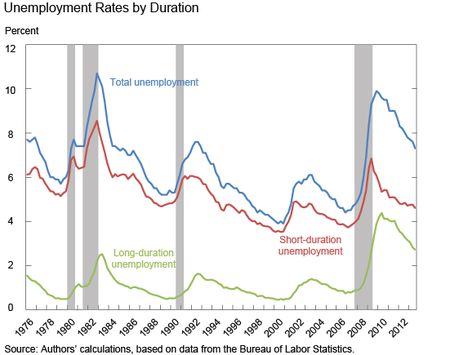
The chart below plots the total, long-duration, and short-duration unemployment rates, with the division between short- and long-duration unemployment defined, respectively, by unemployment spells of 26 weeks or less and 27 weeks or more. Until the past few years, the U.S. experience has been that most fluctuations in the total unemployment rate were driven by the short-duration unemployment rate. The average of the long-duration unemployment rate was only 1.0 percent from 1960:Q1 to 2007:Q4, with deviations around the average fairly muted and short-lived. However, the long-duration unemployment rate rose to over 4.0 percent during 2009-10, and by December 2013 has only moved down to 2.6 percent.
So, is it important to distinguish between short-duration and long-duration unemployment in the United States? In a recent study, Robert Gordon of Northwestern University uses a Phillips curve model to examine the behavior of price inflation from the early 1960s through early 2013. His findings indicate that short-duration unemployment has a much greater impact on price inflation than does long-duration unemployment. Further, out-of-sample forecasts using short-duration unemployment track price inflation much more closely than those based on the total unemployment rate, especially during the post-2008 period. Our analysis complements the recent work of Gordon and offers some evidence on the robustness of his results by looking at compensation growth, as well as by specifying a different Phillips curve model and by examining a shorter sample period that runs from 1997 through the present.
In a conventional compensation Phillips curve model, the indicator of resource utilization is the unemployment gap, measured as the difference between the unemployment rate and the non-accelerating inflation rate of unemployment (NAIRU). Conceptually, if the economy were operating with the unemployment rate at NAIRU, inflation would not have a tendency to either increase or decrease. Positive values of the unemployment gap indicate excess supply conditions in the labor market which should put downward pressure on compensation growth (and vice versa).
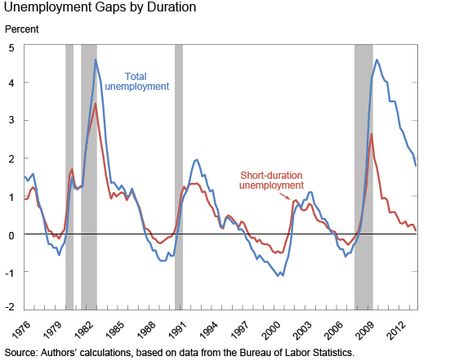
We compare forecasts of compensation growth using two alternative measures of the unemployment gap—one based on the total unemployment rate and another based on the short-duration unemployment rate. The total unemployment gap measure is the difference, measured in percentage points, between the total unemployment rate and the Congressional Budget Office (CBO) estimate of NAIRU. The short-duration unemployment gap is constructed as the difference between the short-duration unemployment rate and our estimate of the short-duration NAIRU. The latter is the CBO estimate of NAIRU less the average of the long-duration unemployment rate calculated over the 1997-2007 period.
As shown in the chart below, there had been a very close correspondence between the two unemployment gaps until the onset of the most recent recession. Currently, the total unemployment gap indicates a large amount of slack in the labor market, while the short-duration unemployment gap indicates little, if any slack.
Following an earlier post on compensation growth, we specify a nonlinear compensation Phillips curve model (see this paper by Fuhrer, Olivei, and Tootell for a discussion of modeling the nonlinearity). The model relates the four-quarter growth rate in compensation per hour in the nonfarm business sector, relative to trend productivity growth and long-run inflation expectations, to resource utilization. For trend productivity growth, we use a twelve-quarter moving average of the (annualized) quarterly growth rate of productivity. For expected inflation, we construct a measure for the personal consumption expenditure index (PCE) by adjusting the Survey of Professional Forecasters ten-year expected CPI inflation series to account for the usual differential between CPI and PCE inflation. As in our previous post, we focus on the post-1997 period because it represents a low-inflation environment, based on the level and stability of the expected inflation series, and because we believe the nonlinearity may be especially relevant in such an environment.
We examine both the within-sample fit and out-of-sample forecasts of the models to evaluate the alternative unemployment gap measures. The out-of-sample forecast performance is based on estimation of the model using data through 2007:Q4. With the resulting estimated model, we input the actual values of the unemployment gap, trend productivity growth, and expected inflation series for the post-2007:Q4 period to generate forecasts of compensation growth. The first forecast corresponds to compensation growth from 2008:Q1 to 2009:Q1.
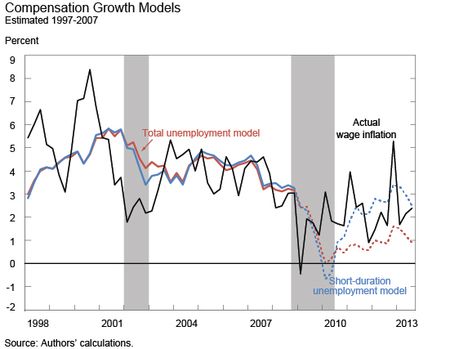
The next chart plots the four-quarter change in compensation growth, the within-sample fit of the models through 2007:Q4, and the post-2007:Q4 out-of-sample forecasts.
Not surprisingly, the within-sample fit of the two models is very similar due to the two unemployment gap measures closely tracking each other during this period. The out-of-sample forecasts, however, reveal the different implications of the two unemployment gap measures. While the compensation growth series displays some volatility and both models missed the initial slowing and subsequent rebound in the series, the forecast using the short-duration unemployment gap does a better job tracking the subsequent movements in compensation growth and is about 10 percent more accurate than the forecast that ignores the duration of unemployment. The graph also illustrates that the forecast using the total unemployment gap have consistently underpredicted compensation growth, a feature shared by price-inflation Phillips curve models. Although they are not shown, we obtain similar results if we start the out-of-sample forecasts in 2004:Q4.
Our results raise an interesting question—why has the distinction between short-duration and long-duration unemployment in the United States previously received so little attention? One answer is that the close correspondence between the total unemployment rate and the short-duration unemployment rate has masked the importance of the latter variable. If movements in the unemployment rate are largely driven by the short-duration unemployment rate, then the unemployment gap is a suitable proxy for measuring slack in the labor market—even if the appropriate measure is the short-duration unemployment gap. It is only since the last recession and its aftermath, when the composition of the total unemployment rate deviated from its historical pattern, that we can observe the differential effects of unemployment duration on compensation growth.
Disclaimer
The views expressed in this post are those of the authors and do not necessarily reflect the position of the Federal Reserve Bank of New York or the Federal Reserve System. Any errors or omissions are the responsibility of the authors.

M. Henry Linder is a senior research associate in the Federal Reserve Bank of New York’s Research and Statistics Group.

Richard Peach is a senior vice president in the Federal Reserve Bank of New York’s Research and Statistics Group.

Robert W. Rich is an assistant vice president in the Federal Reserve Bank of New York’s Research and Statistics Group.


 RSS Feed
 Follow Liberty Street Economics
Lisa—We’re glad you enjoyed the post. As far as the model’s implications going forward, they would depend on a forecaster making two judgments. First, the period over which to estimate the coefficient on the unemployment gap variable (Recall that we set the coefficients on the long-run inflation expectations and trend productivity growth variables equal to unity). Second, the future paths of the unemployment gap, long-run inflation expectations, and trend productivity gap variables. The forecasts can then be generated by feeding the paths for the three aforementioned variables through the estimated model. Steffan—Thanks for your question. It is important to stress that we are using a stylized model for compensation growth, and that we also needed to exercise some judgment as far as when to undertake the out-of-sample forecast exercise. We selected 2007:Q4 because we didn’t want the Great Recession to influence the estimated parameter on the unemployment gap variable. Rather, we wanted to evaluate the forecast performance of the models over the post-2007:Q4 period—that is, during the period of the Great Recession and beyond. It is possible that the out-of-sample forecast exercise starting in late 2009 might generate different results. However, such an exercise would rely on different estimates on the coefficient on the unemployment gap variable. There is the additional question of how to calculate the short-duration NAIRU using data through late 2009. Without some construct of the short-duration NAIRU and extending the estimation through late 2009, we can’t make a judgment about the relative performance of the two models.
Nice work, again. As we sort through an unprecedented labor market we will test more models. Our old models of GDP and wage linkage will be re-examined as well. The long term unemployed are losing existing skills due to non-use but also no longer learning new skills from working in an adaptive and changing workplace. As workers continue to loose “skill equity” they will earn lower wages coming into a workplace they have been absent from for far too long.
Very interesting note. I was wondering whether you have tried jumping your model off a later date. My thinking is that your results are likely sensitive to the jump off date. I can imagine that if you jump off late 2009, say, the total unemployment model might track actual wage inflation closer (by predicting flat growth), whereas the short-term unemployment model would call for far too much acceleration. Is this intuition correct? Many thanks.
Nice work, again. As we sort through an unprecedented labor market we will test more models. Our old models of GDP and wage linkage will be re-examined as well. The long term unemployed are losing existing skills due to non-use but also no longer learning new skills from working in an adaptive and changing workplace. As workers continue to loose “skill equity” they will earn lower wages coming into a workplace they have been absent from for far too long.
Nice work, again. As we sort through an unprecedented labor market we will test more models. Our old models of GDP and wage linkage will be re-examined as well. The long term unemployed are losing existing skills due to non-use but also no longer learning new skills from working in an adaptive and changing workplace. As workers continue to loose “skill equity” they will earn lower wages coming into a workplace they have been absent from for far too long.
Hi All, I think the concept of separating long and short duration unemployment and regressing it against wages is very interesting. I am wondering if you did any work on the predictive nature of this? I.e. what are the implications for wage growth going forward? Thank you, Lisa H.