4/27: Following strong reader interest, we began sharing the Weekly Economic Index on the New York Fed’s public website. Look for it twice weekly on Tuesday and Thursday at 11:30 a.m.
Economists are well-practiced at assessing real activity based on familiar aggregate time series, like the unemployment rate, industrial production, or GDP growth. However, these series represent monthly or quarterly averages of economic conditions, and are only available at a considerable lag, after the month or quarter ends. When the economy hits sudden headwinds, like the COVID-19 pandemic, conditions can evolve rapidly. How can we monitor the high-frequency evolution of the economy in “real time”?
To address this challenge, we compute a Weekly Economic Index (WEI) to measure real economic activity at a weekly frequency. Few of the government agency data releases macroeconomists often work with are available at weekly or higher frequency. While financial data, like stock market prices and interest rates, are available at high frequency, we are particularly interested in real activity, not financial conditions. For our purpose, most weekly series come from private sources like industry groups, which collect data for the use of their members, or from commercial polling companies.
The table below details the series we use in our baseline index. These include a measure of same-store retail sales, an index of consumer sentiment, initial unemployment insurance (UI) claims, an index of temporary and contract employment, a measure of steel production, a measure of fuel sales, and a measure of electricity consumption. We transform all series to represent 52-week percentage changes, which also eliminates most seasonality in the data. As the current situation evolves, we may incorporate additional series to refine the index in the coming weeks.
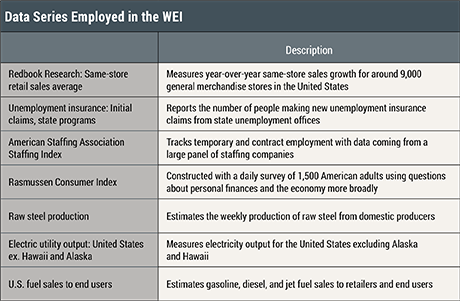
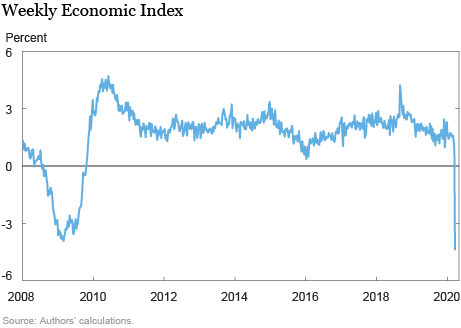
To compute our index, we extract the first principal component from these seven time series, using the sample from January 2008 to present. We scale our index to four-quarter GDP growth, so a reading of 2 percent in a given week means that if the week’s conditions persisted for an entire quarter, we would expect, on average, 2 percent growth relative to a year previous. The chart below plots the index based on data through March 21, 2020. The trough of the Great Recession is clearly visible, as well as the following recovery. Developments in the past week saw the index fall to a level unseen since 2008.
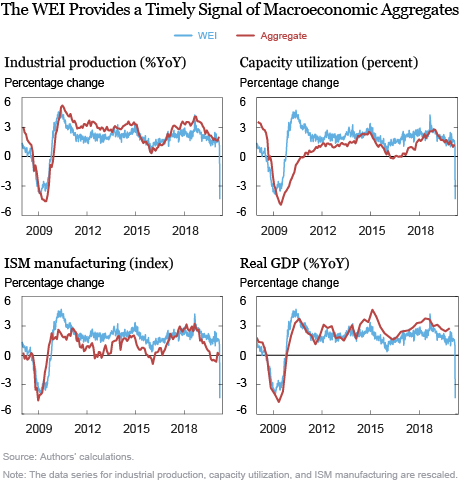
In the interim, fluctuations have been smaller, but correspond well to the paths of important macroeconomic aggregates. The top left panel of the following chart plots the index against the twelve-month percentage change in industrial production (IP). The index tracks IP growth very closely. The top right and bottom left panels do the same for capacity utilization (CU) and the ISM manufacturing index. Finally, we plot four-quarter GDP growth. It is clear that despite the noise inherent in the raw, high-frequency data, combining it to construct an index, as we do, provides an informative signal of real economic activity.
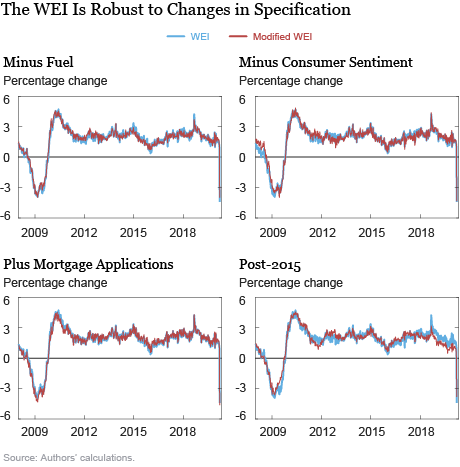
Our index is also quite robust to changes in the way it is constructed. Subtracting or adding individual series has little effect on the overall path; the same is true for estimating the weights on each series using only more recent data. The top left panel of the chart below compares our baseline index to one without fuel sales, and the top right panel to one without consumer sentiment, while the bottom left adds data on mortgage applications for purchase. Clearly, the common signal is not driven by the precise choice of series. The bottom right panel plots our baseline against a series computed with weights estimated using only data from 2015 onward, showing that the relationship between these series has been fairly constant during and after the Great Recession.
Historically, the WEI has been informative for real economic activity. But what does it tell us about the current challenge presented by COVID-19? The next chart zooms in on the index from November 2019 to present. The effects of the pandemic become visible in the week ending March 21. This week saw an unprecedented 3.28 million UI claims, a sharp decline in consumer confidence and fuel sales, and a more modest decline in steel production, but also a countervailing surge in retail sales, as consumers took to stores to stock up. In spite of this positive signal from retail sales, and the relatively mild declines in some other series, the UI release drove the WEI to a level not seen since the 2008 financial crisis. Each week, as data releases arrive one by one, the index can be forecast based on historical relationships between the index, the available series, and lags of the unavailable series.
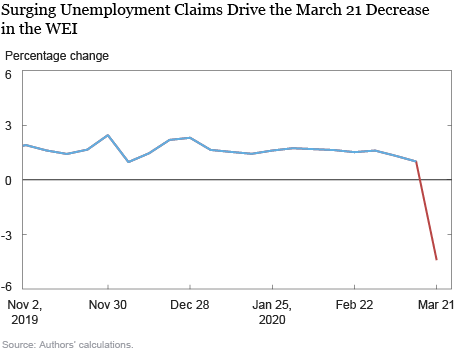
This example also helps to illustrate two important differences between our index and a nowcast, like the one we regularly produce for GDP growth here at the New York Fed. First, a nowcast focuses on a single important target series, and uses the information contained in intermediate data to predict that series. In contrast, while we report the WEI in GDP growth units, this is simply an ex post normalization; the WEI does not focus on a single outcome by targeting either a consumption variable or a production variable—both are important to get a sense of real activity. Second, most nowcasts (including the New York Fed’s) focus on lower-frequency targets like GDP growth, which are very informative about the economy. But, since GDP is a quarterly variable, such models are not equipped to highlight variation from one week to the next. Their goal, which they do well, is simply to predict average variation in the target series over thirteen weeks.
However, even though we do not explicitly target a low-frequency variable, we can assess the predictive power of the WEI for a range of such macroeconomic data. We find that the WEI (and lags) predicts 84 percent of variation in the month-on-month change in private nonfarm payroll employment. When we regress monthly IP growth and CU on the weekly WEI (and lags), we are able to predict 26 percent of the variation in each series. In particular, the final week of each month is a highly statistically significant predictor of the eventual monthly release.
In normal times, familiar macroeconomic aggregates provide accurate descriptions of economic conditions with a modest delay. But, in a tumultuous setting, when conditions evolve rapidly from day to day and week to week, less familiar sources of data can provide an informative signal of the state of the economy. The WEI provides a parsimonious summary of that signal.
 Daniel Lewis is an economist in the Federal Reserve Bank of New York’s Research and Statistics Group.
 Karel Mertens is a senior economic policy advisor at the Federal Reserve Bank of Dallas.
Jim Stock is the Harold Hitchings Burbank Professor of Political Economy, Faculty of Arts and Sciences of Harvard University and member of the faculty at the Harvard Kennedy School.
How to cite this post:
Daniel Lewis, Karel Mertens, and Jim Stock, “Monitoring Real Activity in Real Time: The Weekly Economic Index,” Federal Reserve Bank of New York Liberty Street Economics, March 30, 2020, https://libertystreeteconomics.newyorkfed.org/2020/03/monitoring-real-activity-in-real-time-the-weekly-economic-index.html.
Disclaimer
The views expressed in this post are those of the authors and do not necessarily reflect the position of the Federal Reserve Bank of New York or the Federal Reserve System. Any errors or omissions are the responsibility of the authors.


 RSS Feed
 Follow Liberty Street Economics
In reply to YD: To scale the WEI to GDP growth, we compute the average WEI over a quarter and report the predicted values from a regression of GDP growth on the “quarterly WEI” and a constant.
How do you rescale the pc to GDP growth?
In reply to Woodward: Regular updates are posted at http://www.jimstock.org. We anticipate the WEI being available from FRED in the near future.
Thank you for posting data through 3/21. One of the most interesting questions raised by the WEI of 3/21 is how the 3/28 values will compare to the great recession. Could you please share we we might find the 3/28 value after you publish it?
In reply to Leahey: We are aware of the Homebase labor market data. We are continuing to evaluate potential series and may refine the index in the coming weeks.
Thanks guys, this is very helpful! Are you planning on publishing regular updates and posting the spreadsheet? Thanks, Christian
Thanks for your interest. We anticipate making this data public shortly.
Sensible modeling. You should try to pump in the Homebase labor market stuff. Maybe your ASA series preempts but worth checking.
Will you be publishing this index?
very useful work: will you make the wei data available to the public?