


Editor’s note: When this post was first published, the data in the chart “Delinquency Rates Remain Low Despite Recent Increases” was shifted backward on the y-axis by one quarter and the axis was incorrect. The chart has since been updated. These changes did not alter our conclusions. (November 16, 6 p.m.)
Total household debt balances continued their upward climb in the third quarter of 2022 with an increase of $351 billion, the largest nominal quarterly increase since 2007. This rise was driven by a $282 billion increase in mortgage balances, according to the latest Quarterly Report on Household Debt & Credit from the New York Fed’s Center for Microeconomic Data. Mortgages, historically the largest form of household debt, now comprise 71 percent of outstanding household debt balances, up from 69 percent in the fourth quarter of 2019. An increase in credit card balances was also a boost to the total debt balances, with credit card balances up $38 billion from the previous quarter. On a year-over-year basis, this marked a 15 percent increase, the largest in more than twenty years. Here, we take a closer look at the variation in credit card trends for different demographics of borrowers using our Consumer Credit Panel (CCP), which is based on credit reports from Equifax.
Interpreting the Increase in Credit Card Balances
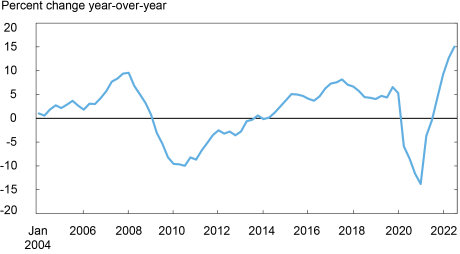
The first three quarters of 2022 have seen a rapid increase in credit card balances, after they contracted sharply during the early part of the COVID pandemic. The chart below depicts the year-over-year percent change in credit card balances—the 15 percent increase seen in the third quarter of 2022 towers over the last eighteen years of data. We measure balances as reported on statements from credit card accounts; these include a mix of new debts from new purchases as well as the revolving component of those balances, the carried-over debts from previous months. Hence changes in credit card balances can be interpreted to include a mix of new consumption, as well as debt repayment.
We’re not able to distinguish between borrowers who repay their balances in full each month from borrowers who revolve balances over time. Thus, interpreting the change in credit card balances needs some context. A large increase in credit card balances is necessarily associated with some amount of consumption. We note that by contrast, a reduction in balances is less straightforward to interpret. A reduction in credit card balances can be caused by declining purchases on cards or a faster paydown of revolving balances.
Credit Card Balances Are on the Upswing
Credit cards are the most prevalent type of debt in the U.S., and there are more than 500 million open accounts. There are 191 million Americans with at least one credit card account, and many have multiple accounts. Indeed, half of all Americans adults have at least two cards, and 13 percent have five or more cards. Credit cards are the most common first credit experience for younger borrowers, as about 73 percent of Americans have a credit card by age 25. Credit card use reflects constant and complex decisions by the credit card holders on consumption, saving, and borrowing: making a purchase, deciding how to pay (between multiple cards, payment options, and cash) and then finally managing their credit card balance by deciding how much of their balance to pay and carry over.
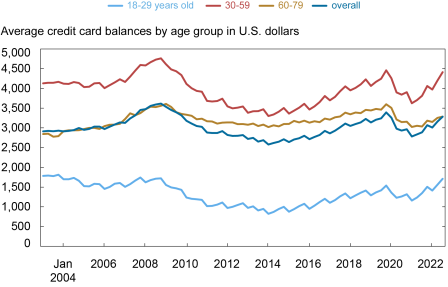
To see if the aggregate patterns of credit card balances were driven by certain borrower demographics, we next turn to average credit card balances, grouped by the age of the borrower. We show three age groups of borrowers here. For older borrowers, those between 60 and 79 years old, their average balances have been rising but remain below where they stood in the fourth quarter of 2019. For those between 30 and 59 years old, balances have increased in recent quarters and are just approaching the level reached in the fourth quarter of 2019. For borrowers under 30, they saw the smallest reduction in their average balances in absolute terms (although note that in percentage terms, this was larger). But their balances are now above where they were pre-pandemic. In sum, the aggregate patterns of credit card balances are well shared by different age groups–even though younger borrowers have higher balances than before the pandemic, this is offset by the lower balances of older borrowers.
Pandemic Credit Card Balance Reductions for Older Borrowers Have Staying Power
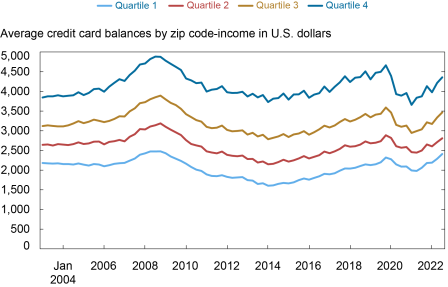
Next, we consider average balances by income to see if there were different behaviors of credit card users across income groups. Although we do not observe income directly in the CCP, we are able to use the borrowers’ zip codes to group them into equal-population income quartiles. Here, we observe that on average, borrowers in all income areas reduced their balances during the pandemic, although that reduction was sharpest among those in the highest-income areas, shown by the dark-blue line in the chart below. This might reflect two characteristics of higher-income borrowers. First, as previously discussed, credit card balances comprise transaction balances and the revolving balances. Also, revolving balances are smoother than transaction balances and are less responsive to changes in consumption. Credit card borrowers in higher-income areas are less likely to have revolving balances, so the credit card balance would decrease more steeply if there is a general consumption decrease. Second, in the height of the pandemic period, discretionary purchases such as travel and leisure purchases were generally limited and dropped more than core purchases. Higher-income borrowers are more likely to consume these goods and services, and from this their consumption dropped relatively more than lower-income borrowers. For those in the highest-income areas, their average balances were $300 lower in September 2022 than in December 2019. For lowest-income borrowers, shown by the light-blue line in the chart below, the reduction in average balances was more modest during the pandemic. Their balances have increased since and have surpassed the average from December 2019.
Balances Increase More in Lower-Income Areas
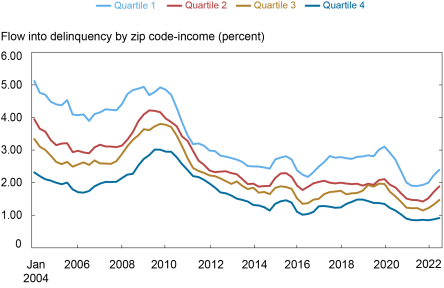
These balance increases, being practically across the board, are not surprising given the strong levels of nominal consumption we have seen. With prices more than 8 percent higher than they were a year ago, it is perhaps unsurprising that balances are increasing. Notably, credit card balances have grown at nearly double that rate since last year. The real test, of course, will be to follow whether these borrowers will be able to continue to make the payments on their credit cards. Below, we show the flow into delinquency (30+ days late) grouped by zip code-income. Here, it’s clear—delinquency rates have begun increasing, albeit from the unusually low levels that we saw through the pandemic recession. But they remain low in comparison to the levels we saw through the Great Recession and even through the period of economic growth in the ten years preceding the pandemic. For borrowers in the highest-income areas, delinquency rates remain well below historical trends. It will be important to monitor the path of these delinquency rates going forward: Is this simply a reversion to earlier levels, with forbearances ending and stimulus savings drying up, or is this a sign of trouble ahead?
Delinquency Rates Remain Low Despite Recent Increases
In conclusion, the aggregate data in our Quarterly Report on Household Debt and Credit point to large increases in credit card balances, accompanied by increases in other types of balances as well. New purchases adding to the credit card balance reflect robust demand amid higher prices of goods and services. The CCP sheds light on the more rapidly increasing debt burdens and delinquency of the younger and less wealthy card holders, and may suggest disparate impacts of inflation. However, though delinquency rates are rising they remain low by historical standards and suggest consumers are managing their finances through the period of increasing prices.

Andrew F. Haughwout is the director of Household and Public Policy Research in the Federal Reserve Bank of New York’s Research and Statistics Group.

Donghoon Lee is an economic research advisor in Consumer Behavior Studies in the Federal Reserve Bank of New York’s Research and Statistics Group.

Daniel Mangrum is a research economist in Equitable Growth Studies in the Federal Reserve Bank of New York’s Research and Statistics Group.

Joelle Scally is a senior data strategist in the Federal Reserve Bank of New York’s Research and Statistics Group.

Wilbert van der Klaauw is the economic research advisor for Household and Public Policy Research in the Federal Reserve Bank of New York’s Research and Statistics Group.
How to cite this post:
Andrew Haughwout, Donghoon Lee, Daniel Mangrum, Joelle Scally, and Wilbert van der Klaauw, “Balances Are on the Rise—So Who Is Taking on More Credit Card Debt?,” Federal Reserve Bank of New York Liberty Street Economics, November 15, 2022, https://libertystreeteconomics.newyorkfed.org/2022/11/balances-are-on-the-rise-so-who-is-taking-on-more-credit-card-debt/.
Disclaimer
The views expressed in this post are those of the author(s) and do not necessarily reflect the position of the Federal Reserve Bank of New York or the Federal Reserve System. Any errors or omissions are the responsibility of the author(s).
 RSS Feed
 Follow Liberty Street Economics