Joshua Abel* and Joseph Tracy
The foreclosure crisis in America continues to grow, with more than 3 million homes foreclosed since 2008 and another 2 million in the process of foreclosure. President Obama, in his speech of February 2, 2012, argued for expanded refinancing opportunities for homeowners and programs to expedite the transition of foreclosed homes into rental housing. In this post, we document the changing face of foreclosures since 2006 and the transformation of the crisis from a subprime mortgage problem to a prime mortgage problem owing to the housing bust and persistent high unemployment. Recognizing this change is critical because the design of housing policies should reflect the types of homeowners who are at risk of foreclosure today rather than those who were at risk at the onset of the financial crisis.
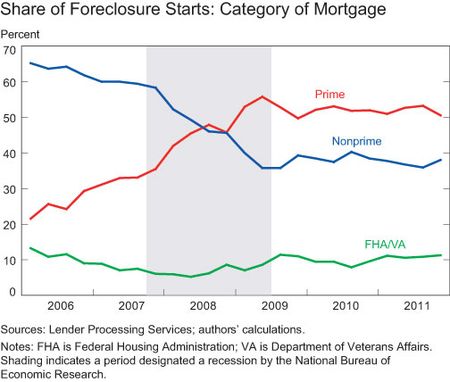
It is well known that problems with nonprime lending helped to spark the housing crisis, which was a catalyst for the financial crisis and ensuing recession. Also well known is the progressive erosion of underwriting standards in nonprime lending toward the end of the housing boom. As a result, many nonprime loans were made to borrowers who did not have the ability to pay for them, especially if house prices did not continue to increase. Not surprisingly, then, as house prices began to flatten and decline in 2006, foreclosure starts were dominated by nonprime borrowers. As shown in our first chart, nonprime borrowers accounted for about 65 percent of foreclosure starts in 2006. However, as the financial crisis led to the Great Recession (indicated in grey), the composition of borrowers entering foreclosure shifted quite dramatically. By 2009, prime borrowers had eclipsed nonprime borrowers as the dominant source of new foreclosures. In fact, from 2009 until the present, prime borrowers have accounted for the majority of all new foreclosure starts. A fairly steady 10 percent of foreclosure starts were associated with mortgages guaranteed by the Federal Housing Administration or the Department of Veterans Affairs.
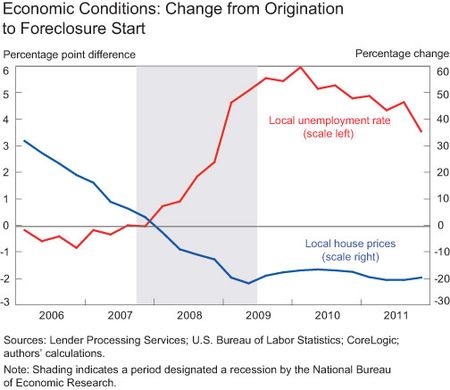
What accounts for the dramatic change in the composition of foreclosure starts since 2006? Our next chart shows two important economic factors that have affected homeowners over this period—house prices and unemployment. For each mortgage that enters foreclosure, we calculate the percentage change in metropolitan area house prices from the time that the mortgage was originated to the time it entered foreclosure. We report average changes across all new foreclosures by year and quarter. From 2006 through 2008, as the share of new foreclosures was shifting from nonprime to prime borrowers, we see that initially foreclosures involved properties that were on average still increasing in value
(as measured by the positive cumulative change in the metro area house price index defined above), but then shifted to properties with declining house prices (in 2008), and eventually to properties where on average house prices had declined by 20 percent (in 2009). In fact, since 2009, properties entering foreclosure have continued to face a 20 percent decline in value on average.
We also calculate the change in the local (defined as the metropolitan area) unemployment rate. Just as foreclosure starts were initially associated with properties whose value was still rising, so foreclosures in 2006 and 2007 were linked to local labor markets where the unemployment rate was still declining. In 2008, however, foreclosures shifted to markets where unemployment was beginning to rise and, in 2009, to markets where unemployment had increased on average by more than 2 percentage points. In 2010, foreclosure starts occurred in markets where the increase in the local unemployment rate exceeded 5 percentage points on average since the mortgages were originated. The shift in the composition of new foreclosures from borrowers with nonprime mortgages to those with prime mortgages reflects the fact that falling house prices and rising unemployment tend to impact all borrowers in a local housing market, not just nonprime borrowers. As a result, traditionally safe borrowers began falling behind on their payments as they felt the severe effects of the housing bust and high unemployment.
In the design of housing policy, an important consideration is the extent to which foreclosures result from situations where borrowers cannot afford their mortgage from the outset. In these circumstances, foreclosures can be viewed as the market process for removing borrowers who should not have been approved for a mortgage in the first place or who cannot sustain their mortgage going forward. When affordability is the key determinant of foreclosures, policies aimed at reducing the flow into foreclosure run the risk of slowing an adjustment process necessary for an eventual housing market recovery. A useful metric for the ability of a borrower to afford a mortgage is the “debt-to-income” (DTI) ratio. This measures the cost of the mortgage (monthly payments, property taxes, and homeowner’s insurance) relative to the borrower’s income. Unfortunately, because the data that we use from Lender Processing Services do not consistently report the DTI ratio, we cannot assess this affordability measure across time for foreclosure starts.
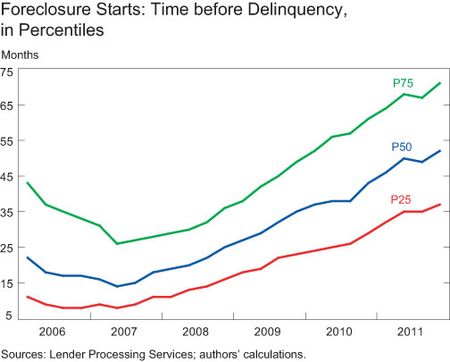
However, we provide an alternative indirect measure of affordability. The basic idea is that in cases where a borrower cannot afford a mortgage from the outset, payment problems are likely to materialize sooner rather than later. In the chart below, we look at the time between the origination of a mortgage and the beginning of the string of missed payments that ultimately led to foreclosure. We show the 25th percentile (25 percent of the times were shorter, P25), the median (50 percent of the times were shorter, P50), and the 75th percentile (75 percent of the times were shorter, P75). Initially, when most foreclosure starts were associated with nonprime mortgages, 25 percent of the borrowers had been in the house fewer than eight months before falling behind on their payments, and 50 percent fewer than eighteen months. However, more recently, as the composition of foreclosures shifted to prime borrowers, 75 percent had been in the house more than three years, and 50 percent more than four years. This suggests that as the recession hit, foreclosures shifted from borrowers who often could not afford their houses to borrowers who had demonstrated that they could (by virtue of making payment for several years) but began to fall behind on their payments when they were hit by the dual crises of house price declines and high unemployment.
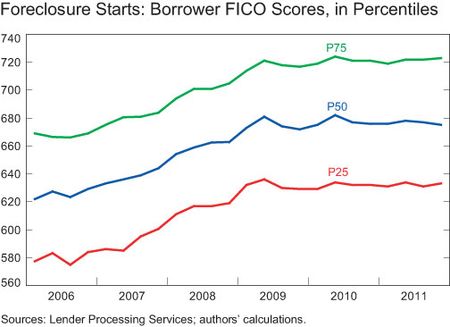
This change in the face of foreclosures is mirrored in many other dimensions. Our last chart shows the evolution in the distribution of origination credit (FICO) scores over time for new foreclosures. In 2006, 25 percent of foreclosure starts were associated with borrowers who had a credit score of 580 or below at the time they took out the mortgage, and 50 percent had credit scores of 620 or below. However, by 2009, as the recession set in and shifted the mix of foreclosures to prime borrowers, 50 percent of new foreclosures had origination credit scores of nearly 680, and 25 percent had credit scores of 720 or higher.
Nonprime lending during the housing boom was concentrated in what were called “exotic” mortgages with little down payment, initial “teaser” rates and, in some cases, negative amortization. However, since 2010, 65 percent of foreclosure starts have been associated with borrowers who took out thirty-year fixed-rate amortizing mortgages (viewed by consumer advocates as the “safest” mortgage product)—up from 40 percent early in the crisis. Similarly, the prime borrowers who have entered foreclosure in the past several years have on average made a meaningful down payment of 20 percent.
A large foreclosure pipeline hangs over U.S. housing markets, creating headwinds for housing market recovery. What began as a nonprime mortgage problem has evolved into a prime mortgage problem with the onset of the recession. The inability to afford a home has been replaced by declining house prices and high unemployment as the primary driver of new foreclosures. Clearly, these changes have implications for the design of housing policy: By recognizing the shifting face of foreclosures, policymakers can make more informed choices about the most effective forms of intervention and the groups of borrowers that could best be served by them.
*Joshua Abel is a research associate in the Research and Statistics Group.
Disclaimer
The views expressed in this post are those of the authors and do not necessarily reflect the position of the Federal Reserve Bank of New York or the Federal Reserve System. Any errors or omissions are the responsibility of the authors.


 RSS Feed
 Follow Liberty Street Economics
Reply to Comments: The traditional view is that defaults happen by necessity rather than by choice. In the case of default by necessity, negative equity is required but must also be combined with another trigger event. There are typically three types of these trigger events that a borrower may experience: an income shock arising from a job loss (or cut in hours/pay), health shock, or divorce. After the income shock, the borrower is unable to continue to make the mortgage payments and due to the negative equity cannot sell the house and pay off the mortgage balance in full. Strategic default, in contrast, is default by choice where a borrower has the ability to continue to make the monthly mortgage payments but decides that it is more economic to default. In this case, negative equity is still required for a default but is not combined with an adverse income shock. Absent data on a borrower’s income over the course of the mortgage, it is difficult to definitively identify strategic defaulters and therefore to assess their relative importance to foreclosures. The data, however, are consistent with the traditional view. Transitions for prime borrowers into initial delinquency follow a time pattern that closely matches the unemployment rate [see the graph at http://newyorkfed.org/research/economists/tracy/PrimeDelFinal.pdf%5D. If defaults by prime borrowers were being driven mostly by strategic defaults, we might expect instead to see the prime delinquency rate increasing steadily over time, as the foreclosure pipeline increased, incentivizing homeowners to stop making their payments while remaining in their homes. Combined with the information in our second chart (Economic Conditions: Change from Origination to Foreclosure Start) in the original post, it appears that the combination of negative equity and income shocks have been an important explanation for prime foreclosures since the recession. This is not to say, however, that strategic default is not taking place or that its prevalence will not increase going forward.
I have some other interesting statistics. At the peak of the employment BLS (Bureau of Labor Statistics) mentioned that there were about 137 MM people employed and about 7MM people lost jobs during the recession. There are about 55MM-60MM (don’t know what is the real number as different data exist) mortgages outstanding. I have to assume that a person having a mortgage has a job. When a person loses job it would be spread equally between a mortgage owner and non mortgage. There was no layoff that targeted mortgage owner per se. So the maximum number of foreclosures should be about 3.5MM (ratio of mortgages to people employed). This does not take into account about 3 MM new jobs have been created in the past 2 years. Looking at the lifetime foreclosures and short sales of all mortgages since 2007 it is way more than 3 MM. Somehow it seems to me that there is lot of strategic defaults going on. Either because investors bought the loans and they are not able to rent. However the rental market is strong and I would think that rental income probably is able to cover the mortgage. I don’t see a study of why foreclosures are high. That analysis may help to solve the crises. Else we can hope for the best.
Another comment I have is to take a look at the delinquency of credit card borrowers to mortgage borrowers. So when Federal Reserve does these kinds of studies they should actually look at different type of delinquency in different loans like credit card and housing, auto loans and student loans. People behave according to various incentives. The credit card delinquencies have significantly dropped, how come delinquency has not dropped in housing sectors. People are choosing to pay their credit card debt, even though it carries high interest. So the behavior is that credit card loans will be required for their lifestyle. I am not sure whether reduction in pay is valid. If the reduction in pay was valid then the income survey released by Federal Government should have shown a reduction. I think there is some stagnation in income, but not a drastic reduction in pay for all the people who have been reemployed. Look at comment from Ben Bernanke today. The long term unemployed are not finding jobs. So the delinquency in housing should have stopped as except the chronically unemployed rest should be able to find job and make a mortgage payment.
I believe the disconnect in the unemployment peak in 2009 and the slight increase of employment to date is the amount of pay. If someone is back at work but at 1/2 of the income, it can make it impossible to make a mortgage payment. The “working poor” seems on the increase. As a loan officer for over 30 years, I frequently talk to potential home buyers with previous credit issues that are in this category. Ellen Tuttle, Sagamore Home Mortgage
Con’t previous comment.. …and you wind up with a property that goes into foreclosure. My policy recommendation would be to make it illegal to list a short sale unless the minimum approved amount the bank will accept is also listed. Sure, this may encourage people to sumbit bids at the minimum but so what? It may also get people to bid up over the minimum too. But at least it would not be a black hole where bids go in and then nothing happens for months. Streamlining the short sale process is, IMO, one of the key ways that the housing market can be cleared without strategic defaults. Further, regulations should be passed that require the banks NOT to report a short sale to credit rating agencies. Lastly, banks who refuse to get with the program should be required to start marking their homes to market via third party BPOs. That would get them moving. There are solutions but we have to stop tiptoeing if we’re going to get there.
Previous comment may be correct. There could be a large element of so called “strategic defaults” occurring. If prime borrowers are theoretically people who CAN pay their bills then they should be coming out of the foreclosure pool as jobs have been created. The fact that there are more prime foreclosures suggests that something unrelated to employment trends is going on. Homeowners in certain states have certanly figured out by now that the time from the start of a “troubled payment history” to an actual foreclosure can be 5-6 years…maybe longer. If a savvy borrower pays a few months, then stops, then starts, etc, they can drag on the process for years on end while only paying a small fraction of their monthly payments. This could help to explain the increase in the mean time to foreclosure. These are more sophisticated borrowers who have learned how to drag out the process and have a free place to live for many months and even many years. Further, with the recent restrictions put in place to slow foreclosures this shows no sign of abating. As long as there are people far enough underwater they will have an ongoing incentive to strategically default. And banks will have a large ongoing incentive to let them strategically default. My personal experience trying to buy a home is that there is absolutely no clarity on the short sale process and banks exhibit no motivation to make those sales happen. So everyone in the process gets frustrated, gives up, and you wind
It is a good piece of article however I am not sure inference is necessarily correct. One of the inferences is that unemployment is causing foreclosures. Unemployment peaked in 2009. Economy has created jobs in 2010 and 2011. Therefore the delinquencies should have peaked in 2009. However the delinquency keeps increasing every month. Somehow I am not able to reconcile both the numbers one goes down and other goes up. What probably is happening is that due to negative home equity somewhat sophisticated borrowers (probably prime) are thinking that it is better to become delinquent and get a loan modification or get a bank to do a shortsale. It takes about 12-24 months to do a foreclosure, therefore live in rent free house as making mortgage does not make sense as one is just paying the money in deep hole. If one looks at the delinquencies of Fannie and Freddie it is the loans that have originated in 2007, 2006 and 2008 have higher delinquencies. Probably because these mortgage owners have the most negative home equity. If unemployment was a factor loans should get delinquent for 2009, 2010 and 2011 book also. I am talking about only prime customers for all the years. I do understand that delinquency is high for 2006-2008 due to liar loans (Alt A) and Subprime loans in Fannie and Freddie books. Subprime borrowers were able to get a loan even in 2006 and now due to FHA, where the delinquency has increased. NY Fed should explore why prime customers are defaulting.