Rajashri Chakrabarti and Matthew Mazewski
Even the most casual observer of American politics knows that today’s Republican and Democratic parties seem to disagree with one another on just about every issue under the sun. Some assume that this divide is merely an inevitable feature of a two-party system, while others reminisce about a golden era of bipartisan cooperation and hold out hope that a spirit of compromise might one day return to Washington. In this post, we present evidence that political polarization—or the trend toward more ideologically distinct and internally homogeneous parties—is not a recent development in the United States, although it has reached unprecedented levels in the last several years. We also show that polarization is strongly correlated with the extent of income inequality, but only weakly associated with the rate of economic growth. We offer several tentative explanations for these relationships, and discuss whether all forms of polarization are created equal.
To measure polarization, we make use of DW-NOMINATE (dynamic weighted nominal three-step estimation), an algorithm developed by political scientists Keith Poole of the University of Georgia, Howard Rosenthal of New York University, and Nolan McCarty of Princeton University. DW-NOMINATE uses roll call voting records to measure the underlying ideological preferences of legislators and groups legislators along two dimensions. The first can be characterized as representing the left-right divide over economic or fiscal issues, while the second captures views on regional or other cross-cutting issues (such as slavery in the mid-1800s or bimetallism later in the nineteenth century). The algorithm’s creators point out that most of the variation in roll call behavior, especially in recent years, can be accounted for by variation along the first dimension alone. Following their lead, we work with only the one-dimensional DW-NOMINATE scores. Scores run from -1 to 1, with negative values taken to indicate liberal views and positive values taken to indicate conservative views.
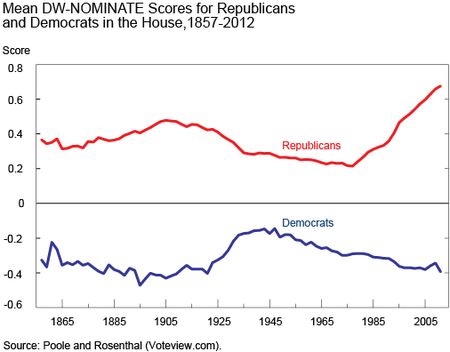
The chart below shows the mean DW-NOMINATE scores for Republican and Democratic members of the U.S. House of Representatives from 1857 to 2012. (Scores are computed at the end of each two-year congressional term.) The difference between these two lines can be interpreted as a measure of polarization, since it shows roughly how far apart the average House Republican and Democrat are ideologically. A similar pattern holds for the Senate (not shown), although the extent of polarization has been greater in the lower chamber.
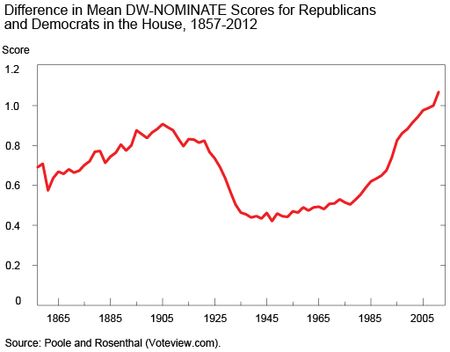
The next chart shows that polarization is hardly a recent phenomenon—the difference in mean DW-NOMINATE scores has been increasing since at least the 1970s and is now at an historic high. The widening gap between the parties also appears to be due more to the average House Republican becoming more conservative than to the average House Democrat becoming more liberal, a phenomenon termed “asymmetric polarization.”
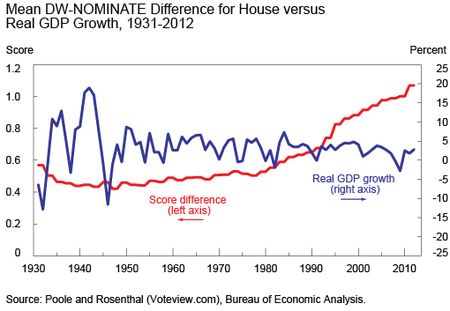
We consider whether polarization is associated with economic growth, since it stands to reason that the failure of the two major parties to forge agreements on domestic policy issues could cause economic performance to falter or that poor economic performance could lead to the empowerment of extreme political factions and an increase in polarization. The next chart plots real GDP growth against the difference in mean DW-NOMINATE scores in the House for the period 1931-2012. (Although not shown, the patterns for the Senate are similar.)
We see no clear relationship between the two series. The correlation coefficient is -0.19, suggesting that the association between growth and polarization is relatively weak.
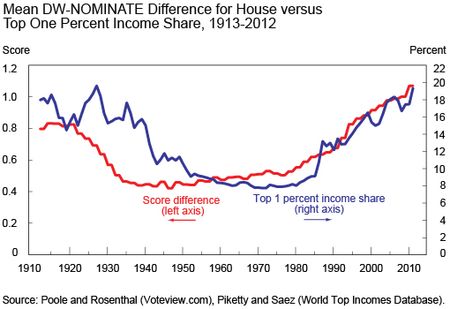
Next we explore the relationship between polarization and income inequality. We present a chart plotting the share of income accruing to the top 1 percent of earners against the difference in mean DW-NOMINATE scores between House Republicans and Democrats. The two series follow strikingly similar trajectories, although it appears that a shift in the polarization measure consistently leads the inequality measure by several years.
The correlation coefficients between the two series are 0.68 for the House and 0.39 for the Senate. Since it looks as if polarization actually precedes inequality by several years, we also look at the correlations between the top income share and lagged polarization. The correlations for polarization lagged five years are 0.82 and 0.56, respectively, and for polarization lagged ten years are 0.91 and 0.72, respectively. This associative relationship continues to hold if we instead look at other inequality measures, like the Gini coefficient or the share of income accruing to the top 10 percent of earners.
Some commentators have opined that the relative ideological distance between the parties might not matter as much vis-à-vis economic outcomes as does the ideological “center of gravity” of policy debates. In light of the evidence for asymmetric polarization, it might be reasonable to suppose that income inequality would follow different paths depending on whether the lion’s share of polarization is attributable to the party that supports increased income redistribution via tax and transfer programs or to the one that favors less government involvement in the economy. In other words, polarization per se may not be as important as the specific way in which polarization unfolds.
To that end, we examine separately the relationship between the income share of the top 1 percent and the mean DW-NOMINATE scores of both party caucuses in each chamber. We find that top income shares are more highly correlated with mean Republican DW-NOMINATE scores in both chambers than with the difference in mean scores, and that Democratic ideology in the Senate is almost totally uncorrelated with inequality. We get similar results when we use the Gini coefficient as the inequality measure.
One possible mechanism by which polarization could affect inequality involves the notion of “policy drift.” That occurs when policies remain in effect despite being outdated or ill-suited to changing circumstances because of political stalemate. For example, many policies are indexed to inflation, but others are not. The ones that are tend to be those that benefit high earners (such as income tax structure) and those that aren’t tend to benefit individuals at the lower tail of the income distribution (such as the federal minimum wage). In a policy-drift story, polarization affects inequality because it contributes to legislative gridlock, which in turn prevents safety nets or tax policy from evolving to handle new challenges.
Another possible channel by which polarization might drive inequality involves financial regulation. Asymmetric polarization associated with a shift of the political center of gravity to the right can lead to lighter regulation of finance, which in turn may lead to rising incomes for individuals in the upper tail of the income distribution.
The subject of income inequality has gotten a great deal of attention in the media over the past several months, and polarization and gridlock have been features of the American political landscape for years. We can confirm that polarization has increased over the past thirty-five to forty years, and that it has done so in an asymmetric way, with Republicans moving further from the center than Democrats. And while we find that polarization is only weakly associated with growth, we find a robust association between a widening ideological gap and income inequality.
Disclaimer
The views expressed in this post are those of the authors and do not necessarily reflect the position of the Federal Reserve Bank of New York or the Federal Reserve System. Any errors or omissions are the responsibility of the authors.

Rajashri Chakrabarti is a senior economist in the Federal Reserve Bank of New York’s Research and Statistics Group.


 RSS Feed
 Follow Liberty Street Economics
Thank you for your interest in our post and for your comment. It is true that significant policy changes have been implemented since polarization began increasing several decades ago, but there is evidence suggesting that congressional productivity has declined as of late: Measures such as the ratio of bills passed to bills introduced or the number of appropriations bills passed by the start of the fiscal year (Congress is required to enact 13 separate appropriations bills to fund various parts of the government by October 1) have fallen in recent years. Regarding inflation indexing, we do not claim that no redistributive benefits are indexed to inflation. And a complete characterization of the differential impact of indexing tax brackets on various income groups is beyond the post’s scope. But our point here is much broader: inflation indexing (or the lack thereof) is but one example of policy drift. It is also important to emphasize, as we do in our post, that we do not claim to have identified a causal relationship running from polarization to inequality, nor do we want to counter evidence from the political science literature which suggests that inequality may contribute to polarization. We also do not claim that DW-NOMINATE scores are predictive of specific policy outcomes, only that they are highly correlated with measures of income inequality. That said, our analysis suggests not only a strong association between polarization and inequality, but it also suggests that polarization leads inequality by several years (see chart in our 6/23 post above). If there is a causal link, we explore some mechanisms that might contribute to this. The notion of policy drift suggests that polarization in Congress makes it difficult to pass substantive laws that might be necessitated by a changing economy. For further discussion of this hypothesis, see “Why Hasn’t Democracy Slowed Rising Inequality?” by Bonica, McCarty, Poole, and Rosenthal, published in the Journal of Economic Perspectives in 2013.
I have two main criticisms–(1) it is extremely hard to divine policy outcomes from DW-Nominate scores and (2) your characterization of policy drift, I believe is just incorrect. For reasons I explain here, DW-Nom don’t actually tell us anything about public policy outcomes. And I think it is very difficult to argue, given the massive changes in public policy that have taken place over the last few decades that the rise in polarization has reduced the ability to our political system to produce substantive policy changes. Also, it is incorrect to assert that indexing taxes to inflation disproportionately benefits the rich–it benefits the middle class. And two, it is also incorrect to say that redistributive benefits are not indexed to inflation. The largest ones are. Additionally, existing political science literature suggests that the direction of causation between inequality and polarization very likely goes the other way. Parties polarize most on votes of economic consequences. As the salience of economic issues has increased, so have the votes on those issues and so has the polarization on those votes. Your argument does not square with how the micro-level of polarization actually manifests. I elaborate on all these point here: http://aapelle.blogspot.com/2014/06/a-response-to-liberty-street-economics.html