The U.S. Treasury market is one of the deepest and most liquid markets in the world, with significant trading in both Treasury futures and benchmark securities. In this post, we examine the pattern of trading activity in these instruments and document the substantial increase in cross-market trading (simultaneous order placement and execution in multiple markets) in recent years, highlighting the impact of technological advancements that allow nearly instantaneous trading across assets and trading platforms. Identifying the growing role played by high-frequency trading in U.S. Treasury markets is important for understanding the price discovery process. Our findings suggest that price discovery takes place on both futures and cash markets and that cross-market trading helps maintain the tight link between the two.
Cross-Market Activity between Cash and Futures Trading Platforms
We measure cross-market activity using transaction-level data with millisecond or higher precision for benchmark U.S. Treasury notes traded on BrokerTec and for Treasury futures contracts traded on the CME. This allows us to first identify “active” milliseconds in each market when trades occur and then compare the timing offset (millisecond lead or lag) of trades for two distinct instruments or markets. In particular, we define a measure of cross-market activity at each offset as the proportion of milliseconds with coincident trading at that offset relative to the total number of active milliseconds in the less active of the two markets. We further correct our measure for the expected proportion of such coincident activity if all trading were independent across markets. The measure can therefore be interpreted as the excess proportion of trading (relative to the least active market) accounted for by cross-market activity.
The chart below displays the cross-market activity measure for the cash and futures ten-year Treasury note markets (based on cash market data from BrokerTec and futures market data from Nanotick). The measure is shown for October 15, 2014, a day with extraordinarily high volatility and trading; for October 16, 2014, another day with somewhat heightened volatility and trading; and for the rest of the other, more typical, trading days in October 2014.
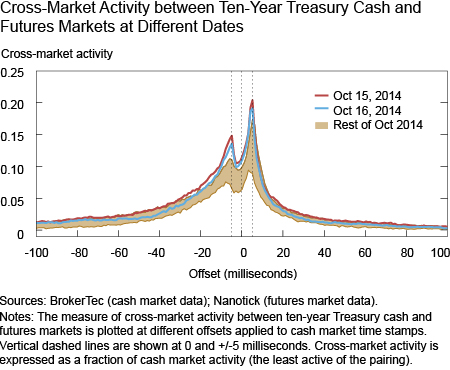
The cash market platform (in Secaucus, New Jersey) and the futures market exchange (in Aurora, Illinois) exhibit very pronounced cross-market trading activity at an offset of +/-5 milliseconds, strikingly consistent with the time it takes to transmit information between the two trading venues using current microwave tower technology. Spikes occur at both negative and positive offsets, suggesting that sometimes Treasury futures lead cash Treasuries (+5 millisecond offset) and other times the cash market leads futures (-5 millisecond offset), a remarkable fact since it indicates that price discovery takes place in both markets as they can both lead each other. The dip at zero is expected because coordinated trading within a millisecond is not possible (although the local leg of a trade could purposely be delayed). However, the measure does not reach zero since trading activity tends to occur in short bursts and some amount of spurious coactivity may be picked up at very small offsets.
Overall, the large share of cross-market activity probably helps explain the extremely tight link between Treasury cash and futures markets. Consistent with this, the two highest volatility days in October 2014, the 15th and 16th, also had the most cross-market activity.
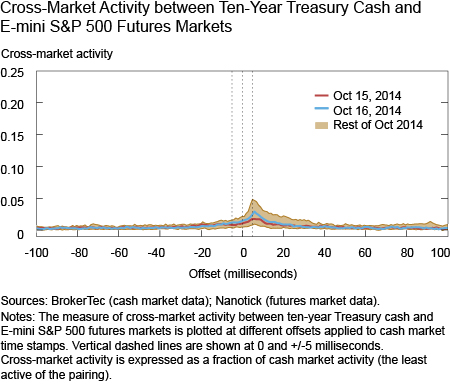
A different pattern emerges when we compare trading activity across substantially different highly active markets, underscoring the fact that the cross-market activity measure is not simply picking up spurious coactivity. For example, overall cross-market activity in the ten-year Treasury notes and E-mini S&P 500 futures is much lower (see chart below) and indicates that, to the extent that cross-market activity does occur, the E-mini market leads the cash Treasury market (+5 millisecond offset) but not vice versa.
Cross-Market Activity across the Curve
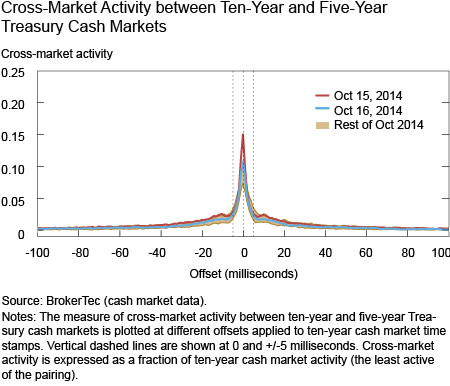
Instruments corresponding to different points on the yield curve are naturally expected to comove, and many common trading strategies involve simultaneously trading two or more instruments of different maturities. The chart below shows cross-market activity for the ten-year and five-year Treasury notes. Based on our measure, cross-market trading accounts for around 8 percent of activity in the cash Treasury market on normal days, but up to 15 percent of activity on October 15, 2014. The location of the peak at zero is intuitive since the notes are traded on the same platform, and the sharpness of the spike, relative to the charts above, indicates that random latency (in other words, the time it takes the platform to process trading instructions) on the cash platform is likely small compared to the millisecond resolution at which the analysis is carried out.
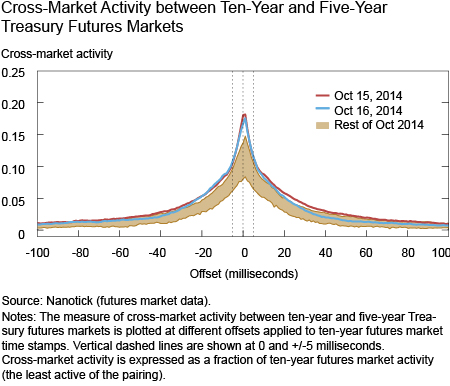
The five- and ten-year Treasury note futures market also shows a spike at zero offset (see chart below), indicating a similarly significant amount of nearly instantaneous trading in these instruments. However, the spike is much more diffuse; it spreads over a much wider millisecond range and in this regard it resembles the bimodal spike seen above for cross-market activity in the cash-futures markets. This might reflect a wider range of available connectivity options to CME as well as some occasional platform latency associated with Treasury futures trading (for more discussion of latency in futures trading, see the recent Joint Staff Report on the events of October 15, 2014).
The Evolution of High-Frequency Cross-Market Activity in U.S. Treasury Markets
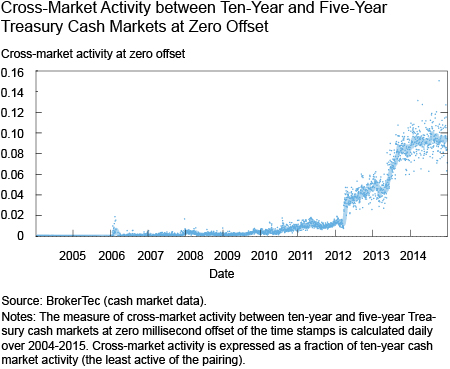
To gauge the evolution of high-frequency curve trading, in the chart below we plot the historical levels of cross-market trading at zero millisecond offset in the ten-year and five-year Treasury note on BrokerTec over the past decade. Early on, during 2004-2006, there was essentially no simultaneous trading in the two markets. Starting with a systems upgrade of the cash platform in March 2006, minor evidence of cross-market activity appears. In March 2012, a major upgrade to the BrokerTec matching engine significantly reduced platform latency, and synchronized trading activity more than doubled. A more gradual but larger increase followed in mid-2013, with synchronized trading activity reaching an average of around 10 percent of total trading activity.
Conclusion
Cross-market trading by now accounts for a significant portion of trading in Treasury instruments in both the cash and futures markets. This reflects improvements in trading technology that allow for high-frequency trading within and across platforms. In particular, nearly simultaneous trading between the cash and futures platforms now accounts for up to 20 percent of cash market activity on many days.
Market participants often presume that price discovery happens in Treasury futures. However, our findings show that this is not always the case: Although futures usually lead cash, the reverse is also often true. Therefore, from a price discovery point of view, the two markets can effectively be seen as one.
Disclaimer
The views expressed in this post are those of the authors and do not necessarily reflect the position of the Federal Reserve Bank of New York or the Federal Reserve System. Any errors or omissions are the responsibility of the authors.
Dobrislav Dobrev is an economist at the Board of Governors of the Federal Reserve System.
 Ernst Schaumburg is an assistant vice president in the Federal Reserve Bank of New York’s Integrated Policy Analysis Group.


 RSS Feed
 Follow Liberty Street Economics
Hi, Thanks for the article. Would you also surmise that the same relationship applies to the S&P Index (and other equity indices)? As in, would the index sometimes lead futures?