


Securities broker-dealers (dealers) trade securities on behalf of their customers and themselves. Recently, analysts have pointed to the decline in U.S. dealers’ corporate bond inventories as evidence that dealers’ market making capacity is impaired. However, historically such inventories also reflect dealers’ risk management and proprietary trading activities. In this post, we take a long-term perspective on the evolution of dealers’ inventories of corporate bonds, Treasuries, and other debt securities and relate those inventories to expected returns in fixed-income markets in an effort to better understand the drivers of dealer positioning.
Corporate Bond and Treasury Dealer Positioning over the Long Run
To study dealer positioning, we rely on data from the U.S. Financial Accounts (previously known as the flow of funds accounts). The security brokers and dealers data of the Financial Accounts are aggregated from the Securities and Exchange Commission’s (SEC) Financial and Operational Combined Uniform Single (FOCUS) reports, which are collected by the Financial Industry Regulatory Authority (FINRA). Each month, registered securities broker-dealers, which are regulated by the SEC, file balance sheet and income data with FINRA for regulatory purposes. Certain aggregate FOCUS report data are made public by the Securities Industry and Financial Markets Association (SIFMA). The longest publicly available aggregate data based on the FOCUS reports are published within the U.S. Financial Accounts by the Board of Governors of the Federal Reserve System.
The chart below shows dealer net positions in Treasury securities and corporate and foreign bonds since 1990. The plot reveals three key features:
- First, dealer net Treasury positions have fluctuated between positive and negative in recent decades. There are some extended periods when net Treasury positions have been negative, such as from 2004 to 2008.
- Second, in the past fifteen years, changes in net Treasury and corporate bond positions have been strongly negatively correlated and hence tending to offset, suggesting that dealers trade the credit spread.
- Third, in the past two years, both Treasury and corporate bond positions have declined, with Treasury positions declining much more.

Fixed-Income Positions Have Declined in Recent Years
We next investigate the sum of net Treasury and corporate bond positions, as well as a broader measure of fixed-income holdings that includes agency and agency mortgage-backed securities, municipals, and other fixed-income assets. From the following chart, we again make three observations:
- First, the sum of net corporate bond and Treasury positions rose fairly consistently between 1990 and 2013, but has declined over the past two years.
- The broader measure of debt securities’ positions mirrors that movement, except for a notable increase during the financial crisis and a subsequent sharp decline.
- Third, comparison with the previous chart reveals that the bulk of the decline in fixed-income securities positions over the past two years is accounted for by a decline in Treasury positions.

The Share of Debt Securities in Total Dealer Financial Assets Has Been Volatile
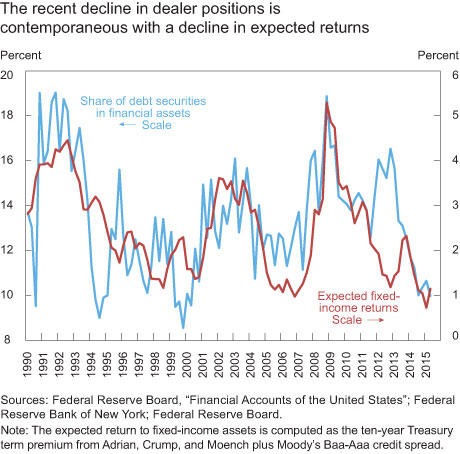
The following chart shows that debt securities as a share of dealers’ financial assets have been highly volatile since 1990, ranging from 9 percent to 19 percent. Most recently, the share has declined to the lower end of this range. This volatility reflects changes in dealer market making and proprietary trading positions.

Dealer Fixed-Income Positioning Correlates with Fixed-Income Expected Returns
We next investigate potential drivers of dealer positioning. While analysts have primarily focused on positioning in the context of the market making role of dealers, dealer positioning also reflects proprietary trading and risk management motives. In the aggregate, such positioning is likely managed to maximize expected returns and hence varies over time with expected returns to fixed-income securities.
In the next chart, we re-plot debt securities as a share of dealer financial assets together with a measure of expected fixed-income returns: the sum of the ten-year Treasury term premium and Moody’s Baa-Aaa spread. The ten-year Treasury term premium, computed by Adrian, Crump, and Moench and posted daily, measures the interest rate risk premium embedded in a Treasury bond portfolio with a ten-year duration. The Baa-Aaa spread is a measure of the credit risk premium.
The chart shows a very tight correlation (55 percent) between expected fixed-income returns and dealer fixed-income positioning, with periods of sharp changes in asset valuations typically accompanied by sharp adjustments in positions. The low level of debt securities as a share of total assets prior to the financial crisis was thus associated with a compression of expected returns at that time. Similarly, the sharp rise in debt securities during the financial crisis corresponded with a period when expected returns were unusually elevated.
The plot does suggest one exceptional period in 2012 and early 2013, when dealer positioning was rising despite ever more compressed expected returns in the bond market. Then-Governor Jeremy Stein warned at the time that fixed-income markets might be overheating, and the Financial Stability Oversight Council’s 2013 annual report issued a similar warning. That episode ended with the bond market selloff in mid-2013, when yields rose abruptly and dealers shed fixed-income positions rapidly.
In the past two years, the tight link between dealer positions and expected returns has returned, in a manner consistent with the historical experience, with both declining sharply. The recent decline in fixed-income positions may thus be explained by the decline in expected fixed-income returns.
Discussion
Previous work has documented the tight linkage between valuations and measures of dealer risk-taking across asset classes including Treasuries and equities. That work finds that dealer balance sheet size and leverage are highly procyclical, with both tending to rise when asset prices rise, and fall when asset prices fall. In contrast, the plot above shows that the share of balance sheet allocated to debt securities is countercyclical: it rises with expected returns, and hence declines as asset valuations increase (as expected returns and asset valuations are inversely related).
It is instructive to consider the depth of the financial crisis as an example of this countercyclical behavior. During that time, dealer balance sheets contracted sharply. Fixed-income positions also contracted, but by less than dealers’ total balance sheets, so that the fixed-income share rose. That increase in the share went hand-in-hand with an increase in expected fixed-income returns, as fixed-income prices collapsed. Hence this episode reconciles the procyclicality of balance sheet size and leverage with the countercyclical share of fixed-income securities in total dealer assets.
In Sum
We analyze the joint behavior of dealer positions in corporate bonds, Treasuries, and other fixed-income securities. We show that the share of debt securities in dealer balance sheets has declined recently, but is within the historical range of the past twenty-five years, and that dealers’ long corporate bond positions tend to be financed by short Treasury positions. We also find that dealers’ fixed-income holdings as a share of their total financial assets is highly correlated with expected fixed-income returns, with the recent decline in fixed-income positions, in particular, going hand-in-hand with a sharp decline in expected fixed-income returns.
Disclaimer
The views expressed in this post are those of the authors and do not necessarily reflect the position of the Federal Reserve Bank of New York or the Federal Reserve System. Any errors or omissions are the responsibility of the authors.

Tobias Adrian is the associate director and a senior vice president in the Federal Reserve Bank of New York’s Research and Statistics Group.

Michael Fleming is a vice president in the Bank’s Research and Statistics Group.

Erik Vogt is an economist in the Bank’s Research and Statistics Group.
 RSS Feed
 Follow Liberty Street Economics
Thanks for your comments. The ratio of dealer inventory as a fraction of outstanding debt gets at a different question than the one we are after in this post. What we are arguing is that dealer balance sheet allocations to different asset classes are at least partially responsive to market conditions, such as expected returns. Hence the ratio of debt securities to total dealer assets is the natural metric. Another question is whether dealer inventory has declined relative to bonds outstanding. This appears to be true for both corporates and Treasuries. In earlier posts (http://libertystreeteconomics.newyorkfed.org/2015/10/redemption-risk-of-bond-mutual-funds-and-dealer-positioning.html, http://libertystreeteconomics.newyorkfed.org/2015/10/has-us-corporate-bond-market-liquidity-deteriorated.html, http://libertystreeteconomics.newyorkfed.org/2015/08/has-us-treasury-market-liquidity-deteriorated.html), we looked at similar statistics, and studied the question of whether market liquidity was adversely impacted. We did not find a broad deterioration of market liquidity, though some liquidity metrics such as market depth in the Treasury market have declined. For corporates, price and quantity based market liquidity measures indicate ample liquidity, and liquidity risk is subdued as well. Of course, the overall decline in the size of dealer assets is a concern that requires further study. We presented an initial assessment in an earlier post (http://libertystreeteconomics.newyorkfed.org/2015/08/whats-driving-dealer-balance-sheet-stagnation.html). Lastly, the corporate debt series examined includes both financials and non-financials.
Hello, Thank you. Would you be able to put some charts/thoughts together of Net Dealer Positions compared to the total size of the debt markets? To me it seems that total amount outstanding has climbed much faster than dealers taking positions with the market. Increased regulation shrinking balance sheets imply this divergence should continue? Wouldn’t this be a better indication of the thinning of the market liquidity & market making capabilities compared to just bond positions/balance sheet of dealers? Federal government debt has climbed from 2831bn in 1990 to 1.4trn in 2014, or about 5x, while net dealer position in treasuries haven’t increased 5x over that period. Is the corporate debt only non-financial corporates?