In this post, we provide a different perspective on the General Collateral Finance (GCF) Repo® market. Instead of looking at the market as a whole, as we did in our previous post , or breaking it down by type of dealer, as we did in this primer, we disaggregate interbank activity by clearing bank and by collateral class. This perspective highlights the most traded collateral and the extent to which dealers at a clearing bank are net borrowers or net lenders. This view of the market is informative given the proposed changes announced recently by the Fixed Income Clearing Corporation.
GCF Repo by Asset Type
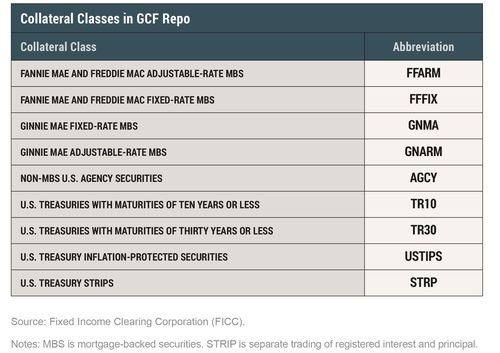
The table below lists the nine collateral classes that make up the GCF Repo market.

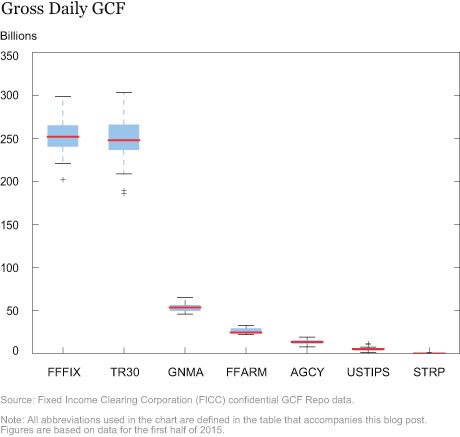
We start by looking at gross activity—defined as the sum of all repos and reverse repos done by dealers in our sample, in a given asset class on each day—to see which assets are the most traded. The chart below shows the distribution of the gross activity over the fourth quarter of 2015. The “box and whisker” chart represents the quartiles of the daily distribution of gross positions. The bottom and the top of the blue box represent the first and third quartiles, while the red center band shows the median. The whiskers represent the smallest and largest non-outlier observations, where an outlier is an observation that lies more than one and a half times the interquartile range above the third quartile or below the first quartile. The two most traded collateral classes in GCF Repo are U.S. Treasury securities with maturities of thirty years or less, and Fannie Mae and Freddie Mac fixed-rate mortgage-backed securities (MBS). All other collateral classes have a much smaller volume of activity. In fact, U.S. Treasuries with maturities of ten years or less and Ginnie Mae adjustable-rate MBS do not appear at all in the sample.

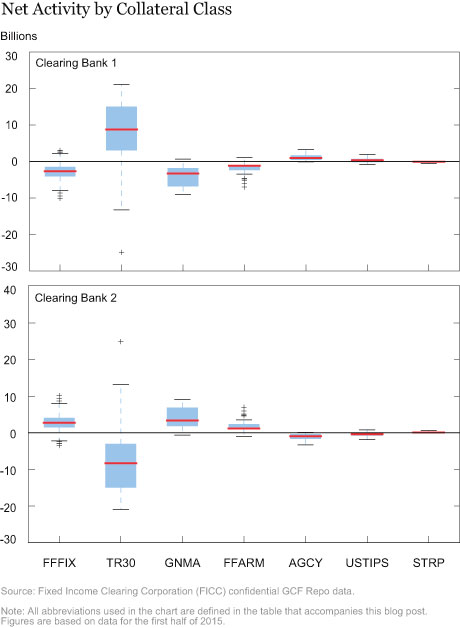
Next, we look at the net activity (repo minus reverse repo) for all dealers at a given clearing bank, for each collateral class. This measure allows us to see if the dealers at a clearing bank are, together, net borrowers or net lenders. If net activity is zero on a given day, then the dealers’ borrowing and lending exactly offset one another. By contrast, positive net activity indicates that the dealers at a given clearing bank are net cash borrowers, while a negative number indicates that they are net lenders to dealers at the other clearing banks. In other words, the net activity, when aggregated to the clearing bank level, measures the size of interbank activity. The chart below shows the distribution of net interbank positions for each of the two clearing banks in the fourth quarter of 2015. By construction, these figures are mirror images of one another since a repo for one dealer is a reverse repo for its counterparty.

In absolute terms, the collateral class with the most interbank activity is, by far, U.S. Treasuries with maturities of thirty years or less. There is also a substantial amount of activity in Fannie Mae and Freddie Mac fixed-rate MBS and Ginnie Mae fixed-rate MBS. All other collateral classes see very little interbank activity. Indeed, in most of the collateral classes, the interbank GCF Repo market never exceeds $10 billion. The only collateral classes for which interbank activity sometimes approaches or exceeds $10 billion are U.S. Treasuries, Ginnie Mae fixed-rate MBS, and Fannie Mae and Freddie Mac fixed-rate MBS.
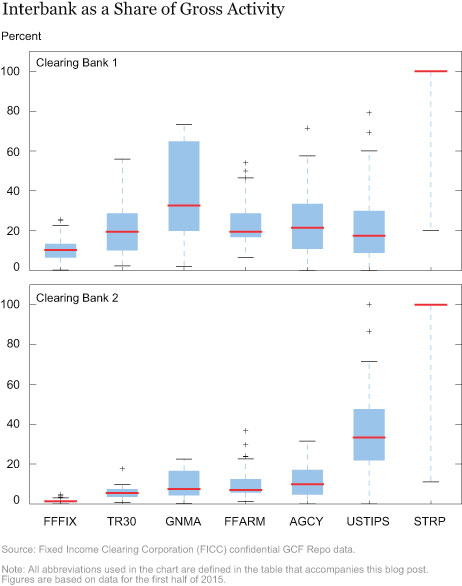
It is also interesting to see the amount of interbank activity as a share of the overall activity by dealers at a clearing bank. In the next chart, we show the absolute percentage of the gross activity that the interbank market comprises—that is, the percentage of gross GCF activity that settles on an interbank basis.

For Fannie Mae and Freddie Mac fixed-rate MBS, the interbank share for clearing bank 1 averages 8 percent, with a ninetieth percentile of 18 percent in the fourth quarter of 2015. This result means that, on average, 8 percent of these dealers’ activity currently settles through interbank GCF. On 90 percent of the days, less than 18 percent settles on interbank GCF. Clearing bank 2’s interbank settlement is almost always smaller relative to the gross activity than clearing bank 1’s, since the absolute value of the net activity must be the same for the two clearing banks, but the gross activity is usually larger for clearing bank 2. We find that the average interbank share is 1 percent, and that on 90 percent of the days, less than 2 percent of activity settles interbank. Within U.S. Treasuries with maturities of thirty years or less, on average, 22 percent of clearing bank 1’s total activity requires interbank GCF to settle. These asset classes represent the most liquid assets financed in the tri-party repo market as well as a large share of the assets financed in that market.
Among the smaller asset classes, the interbank share can be much larger. For clearing bank 1, on the average day, 49 percent of Ginnie Mae fixed-rate MBS settles via interbank, and U.S. Treasury STRIPs settle entirely on an interbank basis for more than 90 percent of the days in the fourth quarter of 2015. This is largely owing to the fact that the gross activity in these asset classes is very small, as shown above.
In our previous post, we showed that interbank GCF is a small share of the tri-party repo market as a whole. In this post, we looked at each asset class in the GCF market to see how much activity currently settles using interbank GCF. We find that in dollar terms, U.S. Treasuries with maturities of thirty years or less and Fannie Mae and Freddie Mac fixed-rate MBS are, by far, the two collateral classes that currently settle the largest amounts on an interbank basis. However, as a fraction of total GCF activity, the amount that settles interbank in these two collateral classes is fairly small.
Disclaimer
The views expressed in this post are those of the authors and do not necessarily reflect the position of the Federal Reserve Bank of New York or the Federal Reserve System. Any errors or omissions are the responsibility of the authors.

Jacob Adenbaum is a senior research analyst in the Federal Reserve Bank of New York’s Research and Statistics Group.

David Hubbs is a payment clearance and settlement associate in the Bank’s Integrated Policy Analysis Group.

Antoine Martin is a senior vice president in the Bank’s Research and Statistics Group.

Ira Selig is a payment clearance and settlement manager in the Bank’s Financial Institutions Supervisory Group.
How to cite this blog post:
Jacob Adenbaum, David Hubbs, Antoine Martin, and Ira Selig, “Understanding the Interbank GCF Repo® Market,” Federal Reserve Bank of New York Liberty Street Economics (blog), May 3, 2016, http://libertystreeteconomics.newyorkfed.org/2016/05/understanding-the-interbank-gcf-repo-market.html.


 RSS Feed
 Follow Liberty Street Economics