It’s long been known that asset prices respond not only to public information, such as macroeconomic announcements, but also to private information revealed through trading. More recently, with the growth of high-frequency trading, academics have argued that limit orders—orders to buy or sell a security at a specific price or better—also contain information. In this post, we examine the information content of trades and limit orders in the U.S. Treasury securities market, following this paper, recently published in the Journal of Financial Markets and earlier as a New York Fed staff report.
The Advent of Electronic Trading
U.S. Treasury securities trade in an over-the-counter market, rather than in an organized exchange. Dealers trade with their customers in the dealer-to-customer market and with one another through the interdealer market. Nearly all interdealer trading occurs through interdealer brokers (IDBs).
Until 1999, nearly all IDB trading occurred through voice-assisted brokers, in which dealers executed trades via phone. In 1999, the eSpeed electronic trading platform was launched, and in 2000, BrokerTec, a rival electronic platform, began operations. These fully electronic platforms paved the way for high-frequency trading, in which traders rely on speed to identify and act upon trading opportunities. The platforms soon accounted for nearly all interdealer trading of the on-the-run notes and bond, the most recently issued notes and bond of a given maturity (see Barclay, Hendershott, and Kotz [2006]).
Liquidity in the Electronic Market
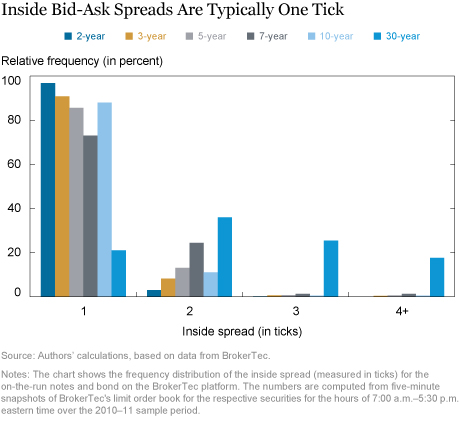
The electronic IDB market is highly liquid. The inside spread (that is, the spread between the best bid and ask prices) averages under 1/100 of one percent (that is, less than $100 per $1 million) for the on-the-run 2-, 3-, and 5-year notes. Moreover, while there is some variation in the spread, it is typically just one tick (that is, the minimum price increment) for the on-the-run notes, as shown in the chart below. (The tick size for the 2-, 3-, and 5-year maturities is 1/128 of 1 percent of par, and that for the 7-, 10-, and 30-year maturities is 1/64 of 1 percent of par.)

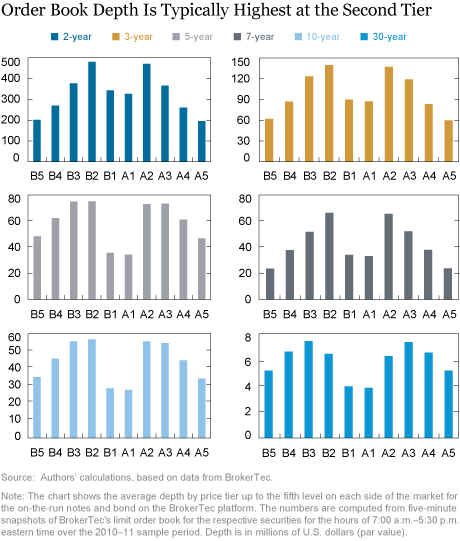
Not only are the spreads between the best bid and ask prices narrow, but there is abundant depth available at these prices to meet trading demand, and much more available at adjacent prices (see chart below). For the 2-year note, for example, there is about $300 million available to trade at either the best bid or the best ask, on average, and $1.5 billion available across the five best bids or asks. This market depth compares to the note’s average trade size of $28 million. While depths in other securities are lower, average depths at their inside tiers alone exceed their average trade sizes, typically by many multiples.

Assessing the Price Impact of Trades and Limit Orders
We quantify the information content of trades and limit orders by their permanent price impact, building on the vector autoregression model of trade and price revision developed by Hasbrouck (1991a). Hasbrouck’s work was intended to measure the information content of stock trades, but we apply it to the Treasury market, and extend it to account for limit order activities as well as trades, as described in our paper.
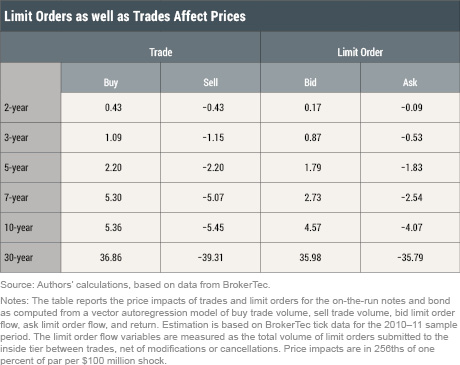
We find that limit orders, as well as trades, affect prices, as shown in the table below. Looking at the 5-year note, for example, the results imply that, all else equal, a $100 million market order to buy will raise the note’s price by just over 2/256 (or just more than one tick). The effect of a sell order is of similar magnitude, but in the opposite direction, as expected. Limit orders also have a price impact, albeit somewhat smaller than that of trades, so an additional $100 million posted at the best price tends to raise the note’s price by just under 2/256 (or just less than one tick). The impact of both trades and limit orders on price increases with security maturity.

That limit order activities play a role in the price discovery process is consistent with O’Hara’s (2015) suggestion that information in high‑frequency markets no longer pertains to only the active side of a trade. Algorithms and dynamic trading strategies enable traders to chop a large order into smaller ones and hide them in the limit order book at various layers. They subsequently show up on the passive side in resultant executions. Thus, estimates of price discovery based on solely trade data are likely to be unreliable.
Information Shares of Trades and Limit Orders
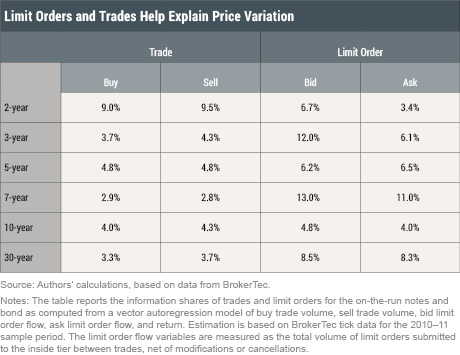
To what extent do variations in the price impact of trades and limit orders drive the variation in prices? For example, trades may have a higher price impact, but if there is not much variation in trade flow, then their role in the price updating process may be limited. Thus, to complement the price impact measure, we also calculate the information shares of trades and limit orders, following Hasbrouck (1991b).
We find that limit order flow generally contributes more to price variation than trades. That is, despite their smaller price impact per unit, limit orders are more important to the price updating process because they exhibit greater variation than do trades. The 2-year note is an exception in that both the price impact and information share of trades are greater than those of limit orders. This difference may be explained by the typically large quantity of standing limit orders in the book for the 2-year note, which potentially delays execution of limit orders and makes such orders less appealing to traders with some information advantage.

Summing Up
Our findings confirm that information in high-frequency markets is not limited to that contained in trades. Treasury market limit orders also affect prices, albeit somewhat less than trades, and limit order flows, because of their greater variation, contribute more to price variation than trades. We broadly conclude that changes in market structure require a reassessment of how information gets incorporated into prices.
References
Barclay, M. J., T. Hendershott, and K. Kotz. 2006. “Automation versus Intermediation: Evidence from Treasuries Going Off the Run.” The Journal of Finance 61, no. 5 (October) 2395-2414.
Fleming, M. J., B. Mizrach, and G. Nguyen. 2018. “The Microstructure of a U.S. Treasury ECN: The BrokerTec Platform.” Journal of Financial Markets 40 (September) 2-22.
Fleming, M. J., B. Mizrach, and G. Nguyen. 2009. “The Microstructure of a U.S. Treasury ECN: The BrokerTec Platform.” Federal Reserve Bank of New York Staff Reports, no. 381, July; revised March 2017.
Disclaimer
The views expressed in this post are those of the authors and do not necessarily reflect the position of the Federal Reserve Bank of New York or the Federal Reserve System. Any errors or omissions are the responsibility of the authors.

Michael J. Fleming is a vice president in the Federal Reserve Bank of New York’s Research and Statistics Group.
Bruce Mizrach is a professor of economics at Rutgers University.
Giang Nguyen is an assistant professor of finance at Pennsylvania State University.
How to cite this blog post:
Michael J. Fleming, Bruce Mizrach, and Giang Nguyen, “Price Impact of Trades and Limit Orders in the U.S. Treasury Securities Market,” Federal Reserve Bank of New York Liberty Street Economics (blog), December 5, 2018, https://libertystreeteconomics.newyorkfed.org/2018/12/price-impact-of-trades-and-limit-orders-in-the-us-treasury-securities-market.html.


 RSS Feed
 Follow Liberty Street Economics