The price impact of a trade derives largely from its information content. The “workup” mechanism, a trading protocol used in the U.S. Treasury securities market, is designed to mitigate the instantaneous price impact of a trade by allowing market participants to trade additional quantities of a security after a buyer and seller first agree on its price. Nevertheless, workup trades are not necessarily free of information. In this post, we assess the role of workups in price discovery, following our recent paper in the Review of Asset Pricing Studies (an earlier version of which was released as a New York Fed staff report).
Background on the Treasury Market
U.S. Treasury securities trade in a dealer-to-customer market, in which dealers make markets to their customers, and in an interdealer market, in which dealers, hedge funds, and principal trading firms trade with one another. Trading in the interdealer market, especially for on-the-run securities, occurs mostly on electronic trading platforms, primarily BrokerTec and Nasdaq Fixed Income (formerly eSpeed). The platforms operate as limit order markets, in which limit orders at various price levels submitted by market participants provide liquidity to market orders that demand liquidity.
How Workups Work
In a typical limit order market, each transaction occurs almost instantaneously as an incoming market order matches up with one or more limit orders on the other side of the market. In the Treasury market, however, the matching of the initial market order is just the beginning of a transaction. Once all possible matches have been made, a short time window opens, allowing market participants to “work up” volume (that is, transact additional volume) at the last price as long as countertrading interest exists.
For example, suppose the best ask price in the limit order book is $99.75 (per $100 par), with $85 million available at that price. A market order to buy $100 million of this security immediately executes against the $85 million. The transaction then enters the workup stage with the $15 million left from the buy order resting in the system. A $20 million sell order then arrives, resulting in a workup trade of $15 million, and a resting sell order of $5 million. Finally, a $5 million buy order arrives, matching with the resting sell order. The order matches of $15 million and $5 million during the workup phase take place at the same $99.75 price as the $85 million order match during the pre-workup phase.
Why Workups Exist
The workup protocol provides traders with a useful tool to manage the exposure of their trading intentions. As discussed in Harris (1997), the revelation of a large trading interest conveys information useful to other traders, who might use it against the exposing trader. With the workup protocol, traders can submit orders of smaller size than their desired quantity (or wait for someone else to expose a trading opportunity), and then seek to expand the quantity during the workup. However, a cost for traders hoping to trade in a workup is that the quantity they want to buy or sell at a given price may not materialize if countertrading interest is lacking.
Workup Prevalence, Size, and Type
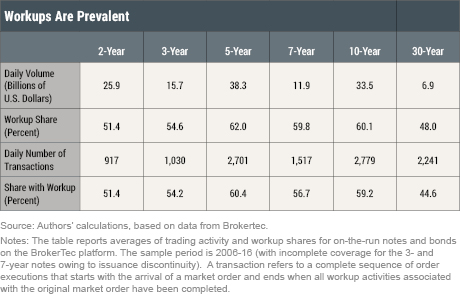
Our analysis (based on data from the BrokerTec platform) shows that workups occur in most transactions and account for most trading volume for on-the-run 2-, 3-, 5-, 7-, and 10-year notes, albeit somewhat less than 50 percent for the 30-year bond (see table below). For the 2-year note, for example, 51 percent of transactions have trading during the workup phase and workups account for 51 percent of volume. Moreover, the share of trading volume in workups has increased in recent years, as shown in the paper and in this earlier Liberty Street Economics post.

Not surprisingly, transactions in which market participants choose to trade additional quantity during the workup phase involve a greater number of order matches and are larger than those without workups. For the 2-year note, the average number of order matches for transactions with workups is 11.0 (3.3 in the pre-workup stage and 7.7 during the workup), whereas the average number for those without is 2.4. Similarly, the average size of transactions with workups is $45.4 million ($16.4 million in the pre-workup stage and $29.0 million during the workup), whereas the average size of those without is $11.7 million. Small trades can be absorbed more easily by outstanding limit orders, and hence are less likely to be executed with a workup.
Not only are we able to distinguish between order matches in the pre-workup stage and order matches during the workup, but we can also discern which side initiates each order match. That is, we can tell whether a trade within a workup was initiated by someone on the same side as the trade initiator, or on the opposite side. Same-side workups are more common. For the 2-year note, 56 percent of transactions have workups with trades initiated only from the same side as the trade initiator, 16 percent from only the opposite side, and 28 percent from both sides.
We also explore how the usage of workups varies with market conditions and find that workups are more likely when volatility and trading demand are high, in line with Duffie and Zhu’s (2017) theory on size discovery. Workups are also more likely when the limit order book is deep, consistent with the intuition that increased competition in liquidity provision might encourage traders to join workups instead of posting limit orders.
Price Impact Segmented by Trade Type
We quantify the information content of trades by its permanent price impact, building on the vector autoregression model of trade and price revision developed by Hasbrouck (1991a). The notable feature of our model is that it accounts explicitly for the segmentation of order flow due to the workup feature.
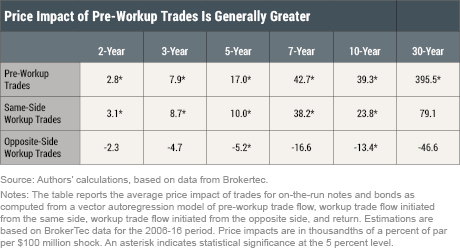
We find that the price impact of pre-workup trades tends to be greater in magnitude, on average, than the price impact of same-side or opposite-side workup trades. The generally greater price impact of pre-workup trades suggests that traders with some information may prefer to execute trades with market orders rather than wait to trade in a workup. The finding that price impact increases with the duration and hence interest rate sensitivity of the security is also sensible and consistent with evidence from prior work. Lastly, that opposite-side workup trades have a negative price impact shows the importance of not assuming, as in past studies, that all trades within a transaction are initiated from the same side.

Our paper also considers the information share of pre-workup and workup order flow, following Hasbrouck (1991b). We find that order flow innovations explain 19-24 percent of price variation, on average, depending on the security, with the greatest share attributable to pre-workup trade flow and the smallest to opposite-side workup flow. Further analysis shows that workups are relatively less informative on days with public announcements, perhaps because private information derived from public information is likely to be short-lived. Workups are relatively more informative on days with extreme order imbalances, when private information is more likely associated with proprietary client order flow information.
Implications
Our analysis illustrates the important role of trading in aggregating private information about asset prices and contributes to the discussion of optimal market design in today’s electronic limit order markets. Continuous limit order markets have shown certain limitations (by encouraging an arms race in trading technology, for example), inviting research into alternative market design features. Our work presents an interesting case study of a continuous limit order market combined with periodic call auctions and offers empirical implications of such a setup.
Disclaimer
The views expressed in this post are those of the authors and do not necessarily reflect the position of the Federal Reserve Bank of New York or the Federal Reserve System. Any errors or omissions are the responsibility of the authors.
 Michael J. Fleming is a vice president in the Federal Reserve Bank of New York’s Research and Statistics Group.
Giang Nguyen is an assistant professor of finance at Pennsylvania State University.
How to cite this blog post:
Michael J. Fleming and Giang Nguyen, “Assessing the Price Impact of Treasury Market Workups,” Federal Reserve Bank of New York Liberty Street Economics (blog), March 6, 2019, https://libertystreeteconomics.newyorkfed.org/2019/03/assessing-the-price-impact-of-treasury-market-workups.html.


 RSS Feed
 Follow Liberty Street Economics
Very interesting results by Fleming and Nguyen, consistent with theoretical work by Haoxiang Zhu on dark pools, which suggests that investors motivated by information are more likely to prioritize execution in lit markets, in order to avoid rationing and delays in size-discovery protocols. http://www.mit.edu/~zhuh/Zhu_darkpool_RFS.pdf