In this post we take up the important question of the sustainability of homeownership for first-time buyers. The evaluation of public policies aimed at promoting the transition of individuals from renting to owning should depend not only on the degree to which such policies increase the number of first-time buyers, but also importantly on whether these new buyers are able to sustain their homeownership. If a buyer is unprepared to manage the financial responsibilities of owning a home and consequently must return to renting, then the household may have made little to no progress in wealth accumulation. Despite the importance of sustainability, to date there have been no efforts at measuring the sustainability of first-time homeownership. We provide an example of a first-time homebuyer sustainability scorecard.
One advantage of the New York Fed’s Consumer Credit Panel data is that it enables us to continue to follow a household after the payoff of its first-time mortgage, which provides a more detailed look at homeownership sustainability. The most obvious case when homeownership was not sustainable is if the household defaulted on its first-time mortgage. Households who go through a default and foreclosure will likely not be able to transition back to homeownership for many years, and certainly are not able to accumulate wealth during their period of homeownership. This difficulty reflects the fact that the household lost its home equity and will suffer a serious deterioration in its credit rating.
In determining whether a first-time borrower defaults, it is important to look through any subsequent refinancing of the initial purchase mortgage to see if the borrower ever defaults while living in the first-time home. This means that a first-time borrower who does not default has successfully paid off the initial mortgage and any subsequent refinance mortgage(s).
At the other end of the spectrum, first-time borrowers who pay off their mortgage(s), move and remain homeowners in their new location demonstrate sustainable first-time homeownership. For our purpose, we do not continue to track households to see if they successfully pay off their trade-up mortgage. The next case of a sustainable first-time homeownership is when the household continues to live in the same residence paying down their initial (or subsequent refinance) mortgage. The longer the household has lived in the residence, the stronger is the case to classify this outcome as an example of a sustainable homeownership.
An intermediate case is when the household successfully pays off its first-time mortgage(s), but transitions back to renting. Here, we exclude brief rental periods that can arise between homeownership experiences. For our sustainability scorecard, we identify those first-time buyers who return to renting for at least three years. We classify these as examples of first-time homeownership that was not sustainable. However, in this scenario, the household’s credit did not suffer damage due to a default and foreclosure. As such, these households likely will face lower hurdles seeking homeownership in the future as compared to households that default.
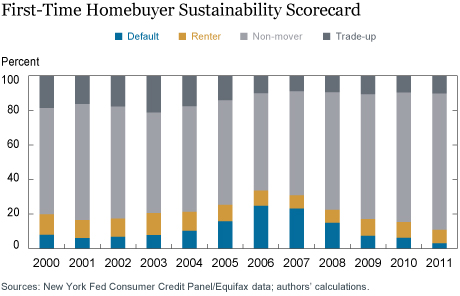
The chart below provides our sustainability scorecard for first-time buyers. We separate each annual cohort of first-time buyers into four categories based on the data that are available to date: default, renter, non-mover, and trade-up. The first two categories represent cases of non-sustainable homeownership while the second two represent sustainable homeownership. We require at least six years of data on a cohort to have a clear insight into the degree of homeownership sustainability for that cohort. We focus primarily on the cohorts prior to 2003 since they were the least impacted by the financial crisis.

The cohorts from 2000 to 2002 were less affected by the financial crisis. For these cohorts of first-time buyers, homeownership was sustainable for roughly 82 percent. This group consisted of around 65 percent who remain in their original home and 17 percent who successfully paid off the mortgage on their first-time purchase, moved, and remained homeowners. As we look past the 2002 cohorts, we can see that the sustainability rate progressively declined, reaching a low of 66 percent for the 2006 cohort. Much of the decline in sustainability was due to an increase in the default rate that was only partially offset by a lower transition rate of non-defaulters back to renting. The recovery in housing markets brought on by the economic expansion has improved sustainability. The 2011 cohort currently exhibits a sustainability rate of 89 percent. Note, though, that the sustainability rates of the more recent cohorts may still deteriorate going forward as we continue to monitor the performance of these cohorts.
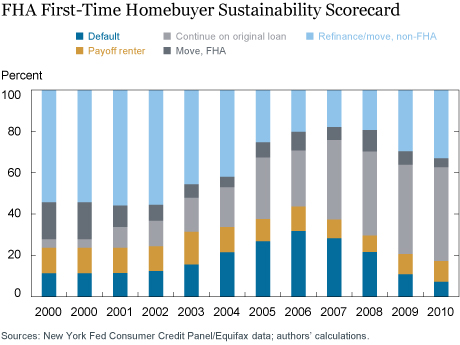
In the first post of this series, “A Better Measure for First-Time Homebuyers,” we documented that first-time buyers are particularly important for the Federal Housing Administration (FHA) program. For that reason, we have also developed an FHA first-time buyer sustainability scorecard. In this scorecard, we differentiate ongoing homeowners by whether they remain with an FHA mortgage or “graduate” out of the FHA program. This is to accommodate the possibility that reviews of the FHA program may view more favorably those cases when first-time buyers sold their home, paid off their FHA mortgage, and purchased a new home financed with a non-FHA mortgage, than similar cases when the new home is financed again with an FHA mortgage.
Our next chart provides our FHA first-time buyer sustainability scorecard. Between 2000 and 2002, roughly 11 percent of first-time FHA buyers defaulted. If we include first-time buyers who return to renting without a default, then roughly one out of four FHA first-time buyers in these three cohorts were unable to sustain their homeownership. Those cohorts of FHA first-time buyers affected by the financial crisis suffered much lower sustainability rates, roughly 45 percent of the 2006 cohort was unable to sustain homeownership.
Focusing on the sustainable outcomes, between 2000 and 2002 roughly 55 percent of first-time buyers paid off their FHA mortgage and graduated out of the FHA system with their trade-up purchase. The remaining cases are roughly equally divided between households that moved, but again financed their home purchase with an FHA mortgage, and households who did not move and continued to pay down their FHA mortgages.

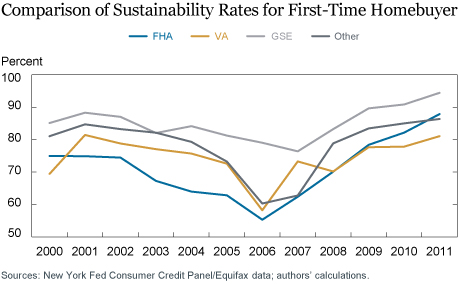
Our first two charts indicate that the FHA program has a lower sustainability rate than the average for first-time buyers. In the next chart we directly examine the sustainability record of first-time buyers broken down by the funder: FHA, Veterans Affairs (VA), Government-Sponsored Enterprise (GSE), and Other, which consists of loans in private-label securities and bank portfolios. Again, we define the sustainability rate for any vintage as the fraction of the borrowers who continue to live in their first-time home or who paid off their first-time mortgage, moved, and remain homeowners. With a few exceptions, the sustainability rate of FHA first-time buyers is generally lower than the other three categories of first-time buyers. In contrast, GSE first-time buyers have the highest sustainability rate.

Averaging across all of our vintages, the FHA sustainability rate is 2.2 percentage points below the VA, 12.4 percentage points below the GSEs, and 8.4 percentage points below the Other categories of first-time buyers. In the second post of this series, “Who’s on First? Characteristics of First-Time Homebuyers,” we described characteristics of first-time buyers and how they have been changing over time. We now connect that discussion with sustainability by examining to what degree these characteristics are associated with sustainable homeownership. In particular, we explore the degree to which the first-time buyer’s credit score, age, average zip-code income, and mortgage balance relate to whether their first-time homeownership is sustainable. We also explore the extent to which differences in these characteristics may help to explain the differences in sustainability rates across the four categories of first-time mortgages.
Our analysis indicates that sustainability is higher for first-time borrowers with higher credit scores, who are older at the time of the purchase, who purchase in zip codes with higher median income, and who have a larger mortgage. When we control for all of these observed differences across first-time buyers, we find that the FHA sustainability rate becomes more comparable to the other types of first-time mortgages. Including these controls, FHA sustainability is roughly equivalent to the VA, 5.6 percentage points below that for the GSEs, and 5.2 percentage points below Other first-time borrowers. That is, roughly half of the observed difference in sustainability between GSE and FHA first-time borrowers is explained by observed differences between their borrowers. However, the FHA/VA programs produce lower sustainability rates even controlling for these observed differences, through a higher default rate for FHA programs and through a higher back to rental rate for VA programs. There are thus factors that are unobservable in our data, but that are associated with lower homeownership sustainability among FHA/VA borrowers. A likely factor is the down payment, which is typically lower in the FHA and VA programs, and may be an indicator of less liquid borrowers.
There is considerable policy focus on first-time homebuyers. Yet, to date we do not have an accurate measure of first-time buyers. In this series of posts, we introduced a new measure of first-time buyers and point out that it indicates that the first-time buyer share has been consistently lower than current measures. We also summarized the characteristics of first-time buyers and how they have evolved over time. Finally, we introduced a sustainability scorecard as an illustration of how to evaluate the effectiveness of different mortgage programs to promote sustainable homeownership for first-time buyers. This scorecard shows that the FHA/VA programs, on average, produce lower sustainability rates even accounting for difference in borrower characteristics.
Related Reading:
Lee, D., and J. Tracy. 2018. “Long-Term Outcomes of FHA First-Time Homebuyers.” Economic Policy Review 24, no. 3 (December): 145-65.
Disclaimer
The views expressed in this post are those of the authors and do not necessarily reflect the position of the Federal Reserve Bank of New York or the Federal Reserve System. Any errors or omissions are the responsibility of the authors.

Donghoon Lee is an officer in the Federal Reserve Bank of New York’s Research and Statistics Group.
 Joseph Tracy is an executive vice president and senior advisor to the president of the Federal Reserve Bank of Dallas.
How to cite this blog post:
Donghoon Lee and Joseph Tracy, “The Sustainability of First-Time Homeownership,” Federal Reserve Bank of New York Liberty Street Economics (blog), April 12, 2019, https://libertystreeteconomics.newyorkfed.org/2019/04/the-sustainability-of-first-time-homeownership.html.


 RSS Feed
 Follow Liberty Street Economics
We thank Joe for his useful comment. A duration constant scorecard has the advantage that the sustainability results for each cohort are based on the same amount of time. We chose to present all of the information for each cohort and to remind readers that the sustainability results for the most recent cohorts will continue to evolve with time.
Can I suggest you need to cut all your cohorts to the same length? Ie if you only have 6 years of data for the 2011 cohort then you should only be showing the % of defaulter / renting / tradeup for the first six years of the other cohorts. If you don’t do this your 2010 has had an extra 10 years to mature than your 2010 cohort meaning your chart is mixing the effect of both what you are trying to show and time.