Total household debt balances increased by $192 billion in the second quarter of 2019, boosted primarily by a $162 billion gain in mortgage installment balances, according to the latest Quarterly Report on Household Debt and Credit from the New York Fed’s Center for Microeconomic Data (the mortgage installment balances exclude home equity lines of credit, which are reported separately and have been declining in balance for some time). The new mortgage total of $9.4 trillion is slightly higher than the previous high in mortgage balances from the third quarter of 2008 in nominal terms.
The source for the Quarterly Report and this post is the New York Fed’s Consumer Credit Panel (CCP), a data set comprised of anonymized credit reports from the credit reporting agency Equifax. We began acquisition of the CCP in 2008, motivated in part by the need to better understand consumer delinquency, which was then reaching unprecedented levels. Although credit bureau data are now commonly used to measure the debt and repayment behavior of consumers in research and financial analysis, our Consumer Credit Panel was an innovation in its use of administrative data and it offers a different perspective than lending industry delinquency data. Here, we describe the composition and application of two alternative measures of delinquency in our Quarterly Report, and clarify how they differ from delinquency rates typically reported by lenders.
Delinquency from a Consumer Perspective
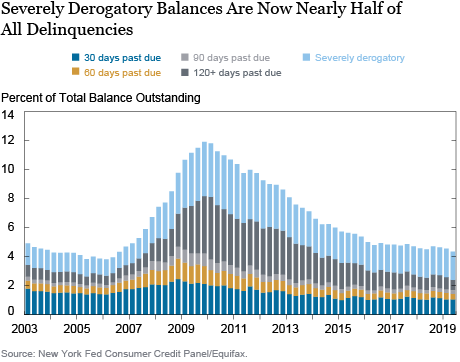
Our Quarterly Report on Household Debt and Credit was designed to measure the health of the consumer balance sheet. Credit bureaus serve as repositories for consumer level “report cards” of borrowing and repayment success, and a simple aggregation of delinquent balances as a percentage of total outstanding balances creates stock delinquency rates as shown below, as well as on pages 11 and 12 of the Quarterly Report. If a debt is newly reported or refreshed to the credit bureau as delinquent within the given quarter, then we count that balance in our delinquency rates, because its presence on the credit report indicates that the borrower owes the debt and the lender is still trying to collect. (The requirement for reporting within the quarter eliminates “stale accounts,” and is discussed in Lee and van der Klaauw, 2011.)
In our data, there are several categories of delinquency – for example, 30, 60, 90, and 120 plus days past due – plus “severely derogatory,” which includes any stage of delinquency paired with a repossession, foreclosure, or “charge off” (meaning that the lender has removed the debt from its books). The delinquency rates published by lenders exclude these charged-off balances, creating a wedge between consumer and lender delinquent debt amounts and delinquency rates. After lenders charge-off non-performing balances from their books, the borrower’s credit report will have a past-due balance until the debt is repaid or sold to a third-party debt collector, or the lender gives up attempting to collect.
Complicating matters further is the fact that lenders offer different loan products and have their own practices for exactly when loans get removed from both sets of books, which makes reconciling delinquency rates across sources and product types very difficult. The credit bureau data do, however, enable us to provide a detailed picture of delinquent debt over time. The chart below depicts the stock delinquency rate, by severity, since 2003. During and after the Great Recession, the 90+ day delinquency rate, especially for mortgages, soared and an unprecedented number of properties entered foreclosure. This created a surge in severely derogatory balances that took years to work down, even as delinquencies other than severe derogatories were declining relatively rapidly. In recent quarters, severe derogatories have been an increasingly important component of total delinquency.

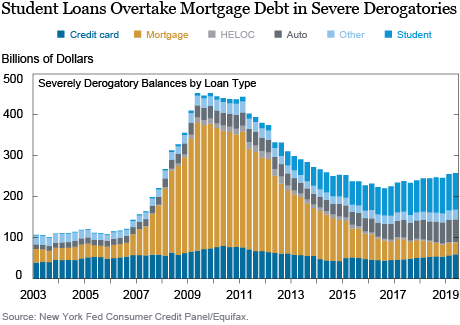
The rise and fall of foreclosures isn’t the entire story, however. In the chart below, we show the changing composition of the outstanding debt balance in severely derogatory status over time. Although the housing crisis produced a huge increase in severely derogatory mortgages, that effect has dissipated as the foreclosure pipeline has cleared out in even the slowest states. Today, auto and especially student loan balances are the interesting components: in the second quarter of this year, the outstanding severely derogatory balance is comprised of 35 percent defaulted student loans, which have grown stunningly since 2012. Auto loans are now 21 percent of the outstanding severely derogatory balance, a larger share than what we’ve seen historically as the auto loan market has expanded and auto loan delinquencies have been increasing for subprime borrowers in the past five years.

Delinquency from the Lender Perspective (Sort Of)
Delinquent debt (including severely derogatory), is important in its own right because it requires repayment, but also because it is reported on credit reports and affects a household’s ability to access credit, among other things. Meanwhile, a lender’s delinquency reports are an important gauge of its health. As we noted above, differences in practices across products and lenders makes it difficult to reconcile the two reports exactly, but one simple way to approximate the latter is based on the observation that a big portion of the defaulted/charged-off debt purged from lenders’ portfolios are reported as severely derogatory in our data. By taking the latter category out, we can compute a delinquency rate closer in spirit to those reported by lenders. When we do so, we find that auto debt has the lowest “adjusted” serious delinquency rate, below even mortgage and HELOC, and student debt has the highest by far. But these relative levels would be misleading. Why? A major reason is charge-off practices—student loans are typically reported as defaulted only after a full year (360 days past due), while auto loans tend to charge off quite quickly, generally before they reach 120 days past due.
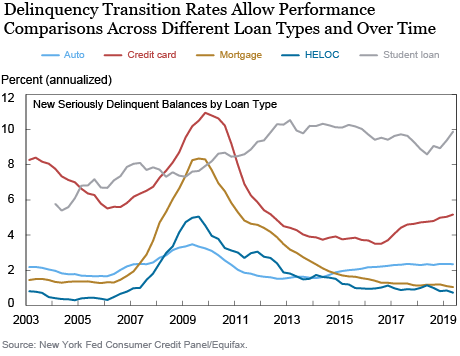
To enable us to see through these different accounting treatments and get a handle on how repayment behavior is evolving over time, we have increasingly focused on delinquency transition rates, which we show in the chart below and that appear on pages 13 and 14 of the Quarterly Report. Transition rates measure the flow of balances that newly reach certain levels of delinquency, such as newly 90 days past due, and are independent of heterogeneous timing of defaults and charge-offs. Conceptually this is similar to the default rate, but instead uses the flow into 90+ day delinquency as a uniform measure that allows comparisons across loan types. Transitions into 90+ days past due (which we report at an annual rate) have been rising for student loan, credit card and, until recently, auto loan balances, while they have been falling for housing-related debt: first- and junior-lien mortgages, as well as home equity lines of credit. Importantly, the trends that we see in our transition rates are qualitatively the same as those trends seen in the lender reported default rates.

The stock delinquency data shown in the first chart above are higher than what are published by lenders, because the lenders have removed the defaulted/charged-off balances. Importantly, however, they continue to attempt to collect on these debts and consumers’ lives continue to be affected. Including such outstanding delinquent debts would thus lead to a better evaluation of enduring consumer financial stress, since this continued reporting matters.
While the health of the household balance sheet remains a focus, we recommend the transition into delinquency charts for those looking to understand the current performance of debts from a lender or industry perspective.
 Andrew F. Haughwout is a senior vice president in the Federal Reserve Bank of New York’s Research and Statistics Group.
 Donghoon Lee is an officer in the Bank’s Research and Statistics Group.
 Joelle Scally is a senior data strategist in the Bank’s Research and Statistics Group.
 Wilbert van der Klaauw is a senior vice president in the Bank’s Research and Statistics Group.
How to cite this post:
Andrew F. Haughwout, Donghoon Lee, Joelle Scally, and Wilbert van der Klaauw, “Just Released: Mind the Gap in Delinquency Rates,” Federal Reserve Bank of New York Liberty Street Economics , August 13, 2019, https://libertystreeteconomics.newyorkfed.org/2019/08/just-released-mind-the-gap-in-delinquency-rates.html.
Disclaimer
The views expressed in this post are those of the authors and do not necessarily reflect the position of the Federal Reserve Bank of New York or the Federal Reserve System. Any errors or omissions are the responsibility of the authors.


 RSS Feed
 Follow Liberty Street Economics
Peter: One key advantage of our transition rates is they measure the flow into delinquency — thus the non-dischargeability is not an issue. It is true that the transition rate on student loans has not improved with the recovery, which is surprising especially with the multitude of repayment plans available to borrowers now. We are currently working on analyses on this topic (stay tuned!).
Thank you for this insightful analysis. The transition rate on student loans seems impervious to economic recovery – in contrast to the other debt types. Part of this is probably that student loans are generally not dischargeable in bankruptcy, but I would be interested in further drill-down on education debt.