Update: Clarifying text regarding the net leverage chart, as well as an additional chart, have been added to the bottom of this post. (January 10, 10:40 a.m.)
Rising nonfinancial corporate business leverage, especially for riskier “high-yield” firms, has recently received increased public and supervisory scrutiny. For example, the Federal Reserve’s May 2019 Financial Stability Report notes that “growth in business debt has outpaced GDP for the past 10 years, with the most rapid growth in debt over recent years concentrated among the riskiest firms.” At the upper end of the credit spectrum, “investment-grade” firms have also increased their borrowing, while the number of higher-rated firms has decreased. In fact, there are currently only two U.S. companies rated AAA: Johnson & Johnson and Microsoft. In this post, we examine recent trends in the issuance of investment-grade corporate bonds and argue that the combination of increased BAA issuance and virtually nonexistent AAA issuance both reduces the usefulness of the BAA–AAA spread as a credit risk indicator and poses a financial stability concern.
Credit Ratings 101
Credit ratings help investors differentiate between bonds with higher credit risk—those assigned a lower credit rating—and lower credit risk—those with a higher credit rating. Because investors are compensated for holding credit risk, higher-rated bonds earn a lower yield. The top of the credit rating spectrum, so-called investment-grade bonds, is bracketed by AAA—the safest credit rating—at one end and BAA (on the Moody’s rating scale) or BBB (on the S&P rating scale, equivalently) at the other. Throughout this post, we refer both to bonds rated BAA by Moody’s and those rated BBB by S&P as having a BAA rating.
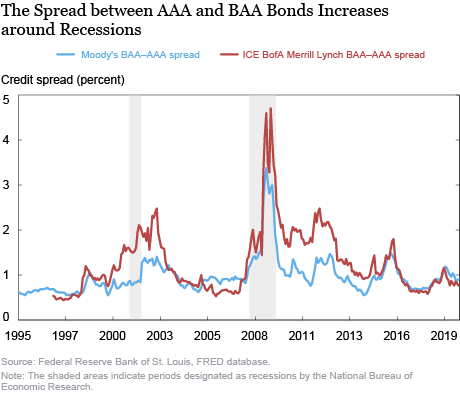
The difference between the yield on AAA-rated bonds and the yield on BAA-rated bonds with similar maturities issued by firms with similar characteristics captures the willingness of investors to hold exposure to corporate credit risk. All else equal, a wider BAA–AAA spread indicates a diminished willingness of investors to bear credit risk. In the lead-up to recessions, investors reallocate their portfolios toward safer securities, as they become more concerned about holding credit risk. As a result, the BAA–AAA spread increases in the lead-up to recessions (see chart below), making the spread a useful indicator of the health of the economy.
The Changing Investment-Grade Landscape
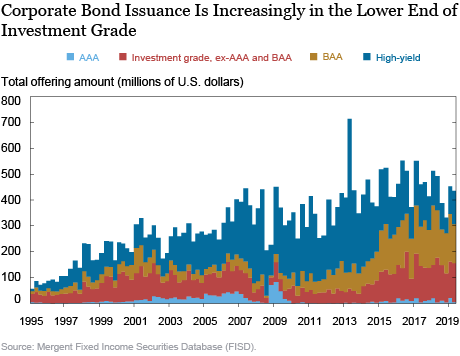
To understand whether the BAA–AAA spread is as informative today about the state of the economy as it was when more companies were rated AAA, we need to examine how corporate bond issuance has evolved over time. The chart below plots the total offering amount, over time, of bonds issued with credit ratings of AAA; investment-grade, excluding AAA and BAA; BAA; and high-yield. The chart shows that, while high-yield issuance has been declining since 2012, investment-grade issuance has been increasing, with BAA issuance matching or exceeding high-yield issuance in every quarter since the fourth quarter of 2016.
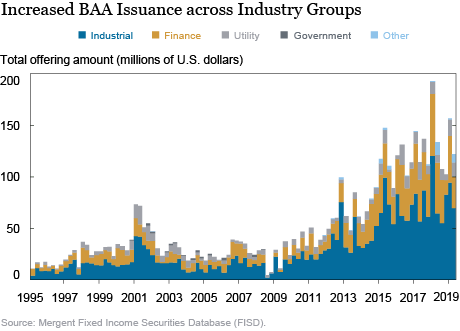
The next chart shows that the increases in BAA issuance occurred across industry groups. Thus, while all of the corporate AAA issuance is concentrated in just two firms, BAA issuance is more widespread, creating a potential mismatch in issuer characteristics between AAA bonds and BAA bonds.
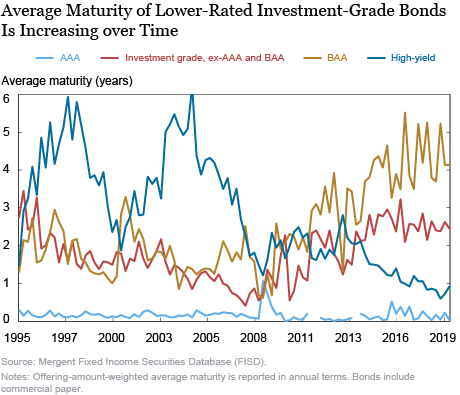
Moreover, the next chart shows that while the average maturity of BAA bonds has been increasing over time, the maturity of AAA bonds has remained relatively stable. Thus, not only are the issuers of AAA bonds no longer comparable to the issuers of BAA bonds, but the average maturity of BAA bonds is far greater than the average maturity of AAA bonds, with the disparity in maturity growing over time. That is, the AAA yield represents the market perceptions of the short-term credit risk of two companies, while the BAA yield captures market perceptions of medium-term credit risk of industrial and financial companies more broadly, potentially making the two yields noncomparable.
Implications for Financial Stability
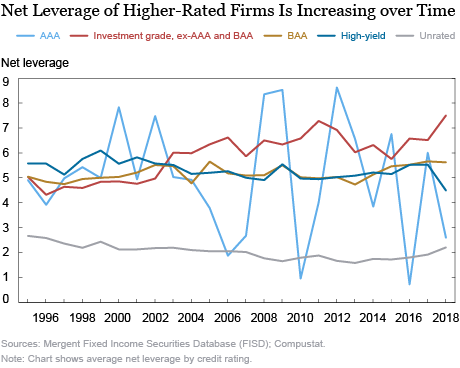
Does increased BAA issuance pose a concern beyond making the BAA yield noncomparable to the AAA yield? One way of answering this question is to look at net leverage—the ratio between a firm’s total debt, less cash and short-term investments, and a firm’s EBITDA—by credit rating category. The chart below shows that, while in the late 1990s through early 2000s the average net leverage of BAA firms was lower than that of high-yield firms, in recent years the net leverage of BAA firms has been similar to that of high-yield firms. Moreover, the net leverage of higher-rated investment-grade firms has exceeded the net leverage of high-yield firms since 2003. Thus, on a net leverage basis, investment-grade firms are currently as risky as, if not riskier than, lower-rated firms.
Moreover, recent academic literature has documented that insurance companies divest from bonds that have been downgraded to high-yield. So bonds that are already declining in price because of a deteriorating credit outlook can face further stress from the associated selling pressure. In the current corporate debt landscape, with a greater amount outstanding of BAA-rated corporate debt and higher net leverage of investment-grade debt overall, the possibility of a large volume of corporate bond downgrades poses a financial stability concern.
Conclusion
With $9.2 trillion outstanding as of the end of 2018, the size of the corporate bond market in the U.S. rivals that of the mortgage-backed securities market. In this post, we argue that, although much of the post-crisis issuance has been in the investment-grade segment of the market, the large volume of issuance with a BAA credit rating may pose a financial stability concern. Moreover, the maturity and firm-characteristic mismatch between bonds with AAA and BAA ratings reduces the usefulness of the BAA–AAA spread as an indicator of investors’ aversion to credit risk.
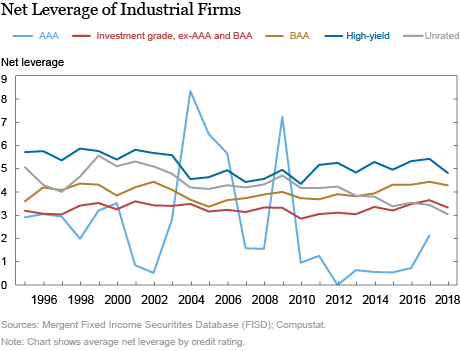
Authors’ note: The net leverage chart included in the post (above) plots the average net leverage for all firms in our sample, reflecting our focus on the overall corporate sector’s bond issuance. If we, instead, restrict to industrial firms only, the picture is somewhat different, as shown in the chart below, with higher-rated industrial firms having lower net leverage than lower-rated industrial firms.
 Nina Boyarchenko is an officer in the Federal Reserve Bank of New York’s Research and Statistics Group.
 Or Shachar is an economist in the Bank’s Research and Statistics Group.
How to cite this post:
Nina Boyarchenko and Or Shachar, “What’s in A(AA) Credit Rating?,” Federal Reserve Bank of New York Liberty Street Economics, January 8, 2020, https://libertystreeteconomics.newyorkfed.org/2020/01/whats-in-aaa-credit-rating.html.
Disclaimer
The views expressed in this post are those of the authors and do not necessarily reflect the position of the Federal Reserve Bank of New York or the Federal Reserve System. Any errors or omissions are the responsibility of the authors.


 RSS Feed
 Follow Liberty Street Economics
One way of answering this question is to look at net leverage—the ratio between a firm’s total debt, less cash and short-term investments, and a firm’s EBITDA—by credit rating category. —– This makes no sense to me. Many firms are issuing debt to restructure their capital from high-cost equity and low-cost debt. An acceptable shift during a period of low interest rates and perceived low returns on capital. As such, firms have been raising debt, retiring equity, and holding more cash. Therefore, to eliminate cash including st investments, is to miss the point of what firms are doing for the purpose of creating a leverage alarm.