Getting health insurance in America is intimately connected to choosing whether and where to work. Therefore, it should not be surprising that the U.S. health insurance market may influence, and be influenced by, the market for higher education—which itself is closely tied to the labor market. In this post, and the staff report it is based on, we investigate the effects of the largest overhaul of health insurance in the United States in recent decades—the Patient Protection and Affordable Care Act of 2010 (ACA) — on college enrollment choices.
The Affordable Care Act revolutionized the health insurance landscape faced by individuals under 65 by creating functional markets for individual insurance and by dramatically expanding Medicaid. People could now get meaningful health insurance coverage without holding a job that offered insurance as a benefit. As a consequence, the ACA should have increased the demand for investment in skills required by jobs that tended not to provide insurance before the passage of the law. Many vocational jobs do not pay high wages or are performed in small enterprises for which the cost of health insurance may be burdensome.
Some examples of jobs in this category are hairdressing, welding, or small business entrepreneurship. These kinds of jobs can be desirable because of the relative independence they provide or because of their low educational requirements but, before the ACA, potential applicants may have hesitated to take such positions because of the difficulties in obtaining health insurance—a phenomenon that economists refer to as “job lock.”
By providing meaningful health insurance outside of the employment context, as well as through the wider availability of insurance in smaller firms, the ACA should have induced individuals who previously were indifferent between taking a job with health insurance and taking a job that is better suited for them but does not offer health insurance, to take the latter. Therefore, we would also expect the ACA to increase the flow of people obtaining the appropriate education for these vocational jobs. Since most of the training for these jobs is provided by less-than-two year for-profit colleges, we would expect the ACA to prompt increased enrollment in these educational institutions.
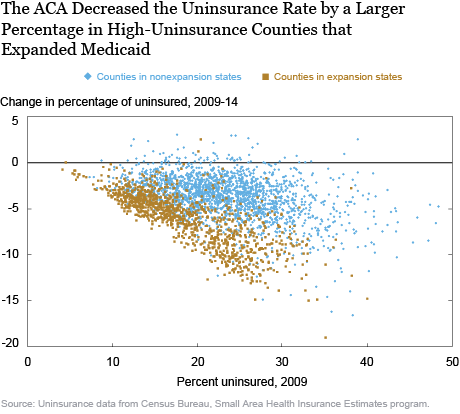
To investigate this hypothesis, the main challenge is to isolate plausibly experimental variation in the exposure of different people to the ACA. In 2012, the Supreme Court allowed states to opt out of the Medicaid expansion, which many states in the South and West chose to do. However, these states are significantly different from the rest of the country—they are generally poorer, faster growing and specialize in different industries—so we cannot confidently reach conclusions just by comparing states that expanded Medicaid with those that did not. Instead, we exploit the facts that (a) the ACA decreased uninsurance by a larger percentage in counties that previously had a high uninsurance rate, and (b) both Medicaid expansion and nonexpansion states had counties with low and high uninsurance rates. We use a continuous measure of uninsurance from the Small Area Health Insurance Estimates, which is the percentage of people without insurance in a county. Conceptually, our methodology is to compare changes in enrollment for high-uninsurance counties relative to low-uninsurance counties, in Medicaid expansion states relative to nonexpansion states.
The chart below plots the reduction in county uninsurance rates following the implementation of the ACA in 2014—a measure of the extent to which the ACA affected the local economy—against county uninsurance rates before the ACA. We see immediately that counties where Medicaid was expanded saw a much larger reduction in uninsurance compared to counties that opted not to expand Medicaid coverage. We also see that both for counties where Medicaid was expanded and for counties where it was not, the higher the uninsurance rate was before the ACA was implemented, the greater the impact the ACA had.

We measure educational outcomes using the Integrated Postsecondary Education Data System (IPEDS), which reports enrollment, demographic composition, and degree attainment (among other variables) for nearly the universe of U.S. colleges. We aggregate this data at the county level (to match our uninsurance data).
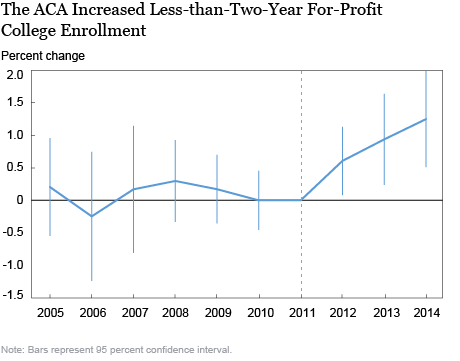
The chart below presents our results for enrollment in less-than-two-year for-profit colleges. Our results take the form of plotting the average percentage difference in enrollment between two counties whose uninsurance rates differ by 1 percentage point in Medicaid-expansion states relative to the difference between similar counties in the nonexpansion states, year by year. We define the set of Medicaid expansion states as those that announced in 2012 their decision to complete the expansion by 2014 as intended by the ACA. We also consider alternative definitions in our staff report, and the results are essentially unchanged. We control for a number of important potential confounds, such as counties being on different trends with respect to educational attainment, depending on their pre-ACA level of insurance, or Medicaid-expansion states being on systematically different educational trends from nonexpansion states. We also present the statistical uncertainty around each of these differences in the form of error bars, which indicate the 95 percent confidence intervals for our estimates.
We recall that the Supreme Court made Medicaid expansion optional in 2012, so if the hypothesis set out above is correct, then we should see differences between Medicaid-expansion and nonexpansion states only beginning in 2012. Therefore, instead of plotting the differences, we plot them relative to 2011, setting the difference in 2011 to zero. The chart below shows that, between 2005 and 2011, the estimates of the difference relative to 2011 are close to zero, with the error bars allowing for the possibility that they indeed are zero. However, in 2012, right after the Supreme Court decision, the difference relative to 2011 becomes positive, with the error bars now excluding zero. This implies that high-uninsurance counties in Medicaid-expansion states experienced more enrollment in less-than-two-year for-profit colleges than did comparable counties in nonexpansion states, while low-uninsurance counties in both sets of states experienced similar enrollment.
The size of the effect grows year after year until 2014 (the last year in our data set). In the sample of Medicaid-expansion states, the median county had an uninsurance rate of 17 percent, a bottom quartile county had an uninsurance rate of 13 percent and a top quartile county a rate of 23 percent. So our coefficient estimate in 2014 in the chart below (1.3 percent) implies that in comparison to a bottom quartile county, the top quartile county in a Medicaid-expansion state experienced an approximately 13 percent increase in enrollment in less-than-two-year for-profit institutions after three years relative to nonexpansion states.

In our staff report, we show that the finding that the increase in the differentials in less-than-two-year for-profit college enrollment after 2012 is a remarkably general and robust finding. We see this pattern among students in different demographic and educational groups, and our findings remain unchanged when we account for possible confounders like county-specific economic recovery paths and state appropriations to public colleges (which compete with less-than-two-year for-profit colleges for students). We also show that there are no changes to enrollment in other types of educational institutions.
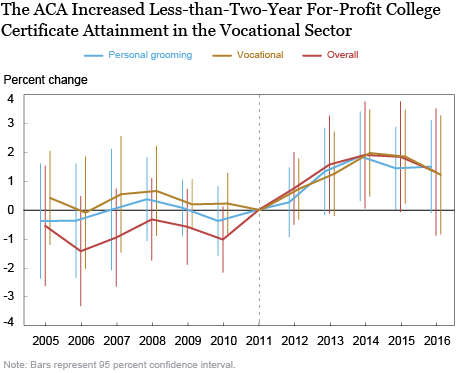
Did the new enrollees at the for-profit colleges obtain the degrees that they sought? Over the last few years, there has been much research showing that, on the whole, less-than-two-year for-profit colleges tend to charge more but improve graduation outcomes by less than other types of colleges. The chart below shows exactly the same kind of plot as the above charts. Here, we investigate whether the ACA and the Medicaid expansion led to a change in certificate attainment. After 2012, the intensively treated counties see much more certificate attainment in less-than-two-year for-profit colleges than would have been expected (gold line). Moreover, the magnitude of this effect matches up closely with the magnitude of the enrollment effect. This suggests that the new enrollees coming in because of the ACA were not less likely to graduate with a degree than was the average student at a less-than-two-year for-profit college. This suggests that they did not go to particularly bad colleges out of this group, and were not particularly ill-prepared. The additional plots in the chart below show that certificates in fields specifically related to occupations with low rates of employer-provided insurance–vocational jobs, and specifically, jobs in cosmetology and personal grooming–were affected to the same or larger extent by the ACA as all degrees taken together. In our staff report, we also show that there was a large but statistically insignificant increase in certificates obtained in health fields, possibly as a demand-side response to the ACA, which is consistent with the literature. Certificate attainment in other majors was unaffected, which is consistent with our theory of the ACA relaxing job lock.

We find that the ACA affected not only people’s ability to get health insurance, but also enabled them to use this insurance to change their lives in other respects. We find evidence that relaxation of the job lock brought about by the ACA led to an increased inflow into vocational degrees in less-than-two-year for-profit colleges. Young adults resorted to retraining offered in less-than-two year for-profit colleges to improve access to jobs in smaller firms or to enter self-employment, opportunities that were less accessible earlier because of insurance, but now are increasingly available because of the more generous insurance provisions under the ACA.

Rajashri Chakrabarti is a senior economist in the Federal Reserve Bank of New York’s Research and Statistics Group.

Maxim Pinkovskiy is a senior economist in the Bank’s Research and Statistics Group.
How to cite this post:
Rajashri Chakrabarti and Maxim Pinkovskiy, “The Affordable Care Act and For-Profit Colleges,” Federal Reserve Bank of New York Liberty Street Economics, February 5, 2020, https://libertystreeteconomics.newyorkfed.org/2020/02/the-affordable-care-act-and-for-profit-colleges.html.
Disclaimer
The views expressed in this post are those of the authors and do not necessarily reflect the position of the Federal Reserve Bank of New York or the Federal Reserve System. Any errors or omissions are the responsibility of the authors.


 RSS Feed
 Follow Liberty Street Economics