In the wake of the coronavirus outbreak, nearly all U.S. states imposed social distancing policies to combat the spread of illness. To the extent that work can be done from home, some workers moved their offices to their abodes. Others, however, are unable to continue working as their usual tasks require a specific location or environment, or involve close proximity to others. Which types of jobs cannot be done from home and which types of jobs require close personal proximity to others? What share of overall U.S. employment falls in these categories? And, given that these jobs will be the most adversely affected, what are the characteristics of workers employed in these jobs? The final question is of particular importance as the government designs and implements policies aimed at helping the workers hardest hit by the pandemic.
Quantifying Job Characteristics
In our recent paper, we delve into these questions by first categorizing jobs as having low or high work-from-home ability, and high or low physical proximity with others. We measure the amount of employment in each of these categories to get a sense of the share in the most vulnerable jobs. Not surprisingly, the analysis suggests that those workers who can’t easily work at home and need proximity to others to do their jobs are bearing the brunt of social distancing policies.
To begin, we follow work by Dingel and Neiman (2020) and use occupational data (O*NET) to categorize jobs as low or high work-from-home ability. The data are based on worker responses to survey questions regarding work arrangements, for example, “How often does this job require working outdoors, exposed to all weather conditions?” Individuals respond on a scale of 1 to 5, with a 5 representing “everyday” and a 1 representing “never.” We use various questions of this kind to create an occupation-specific index spanning from 0 to 1, where 1 represents the lowest work from home ability, and so in a role most likely affected by social distancing. We categorize occupations as low-work-from-home (LWFH) if their index falls above the employment-weighted median index in the population. The third column of the table below gives the ranking of two-digit O*NET occupations by the index, along with the share of employment (second column) in each occupation.
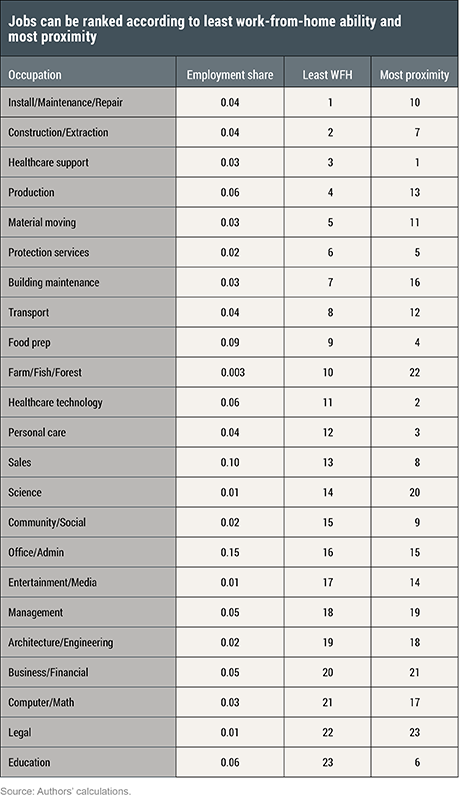
We then construct a measure of an occupation’s degree of physical proximity using the single question, “To what extent does this job require the worker to perform job tasks in close physical proximity to other people?” Answers range from “I don’t work near other people beyond 100 ft.” to “Within arm’s length.” We again construct an occupation-specific index and categorize a job as high physical proximity (HPP) if it is above the employment-weighted median index in the population. The fourth column of the table above gives the ranking of two-digit O*NET occupations by this index.
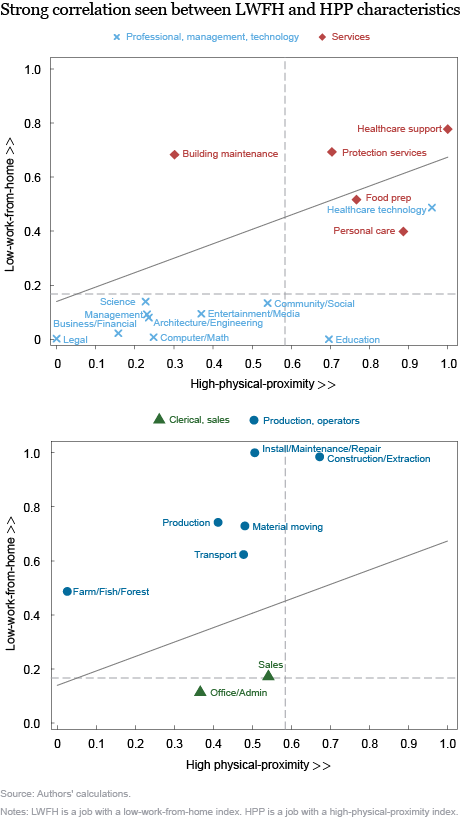
The charts below show how occupations vary across these two metrics. There is a strong positive correlation between the work-from-home and physical proximity indexes across occupations. Typical office jobs in financial services provision or the legal profession can feasibly be done at home, according to our work-from-home measure. There is also little work done within arm’s length in these jobs, so they rank low on the proximity index. By contrast, construction, material moving, and healthcare jobs are LWFH and HPP occupations.
Importantly, a number of occupations stand out as deviations from this pattern. Education jobs require close physical proximity, but few of the features that would prevent the job from being conducted at home. Under broad public policies of social distancing, workers in these jobs can successfully stay employed while operating from home, via virtual teaching. Agricultural jobs (Farm/Fish/Forest), meanwhile, may pose lower contagion risk due to low physical proximity, but are difficult to be done from home.
We next explore the characteristics of workers employed in these types of jobs. To do this, we combine our occupational measures with individual-level data from the Current Population Survey (CPS), which forms the basis of employment statistics in the United States, as well as information on assets from the Panel Study of Income Dynamics (PSID).
From there, our approach is to use regression analysis to look at the connection between job characteristics and worker characteristics, the results of which are depicted in the next chart below. Each dot in the left panel depicts how much more likely workers in low work-from-home jobs are to have the particular characteristic listed on the left. For example, the top blue dot shows that those in low work-from-home jobs are 40 percentage points more likely to have no college degree relative to those in high work-from-home jobs. Similarly, they are 25 percentage points more likely to earn a wage below the median.
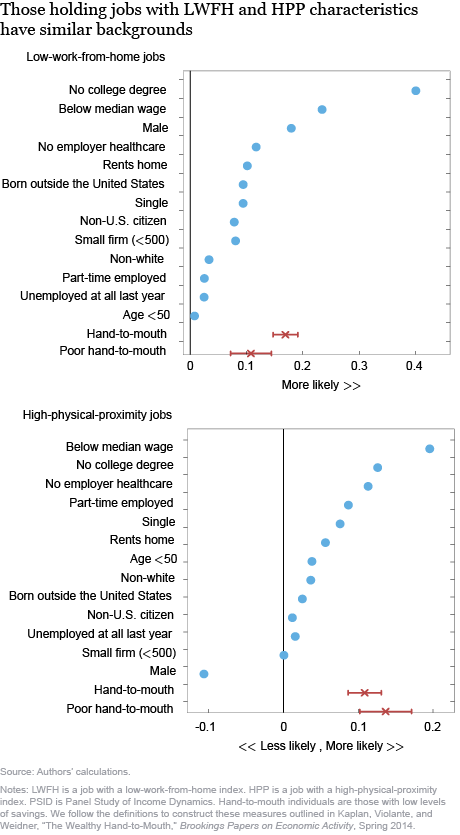
Examining the characteristics paints a consistent picture: workers in LWFH occupations are economically more vulnerable in ways that we try to measure. They are more likely to work in smaller firms, which are on average less financially robust and so more likely to suffer from the financial effects of the crisis. They are more likely to rent rather than own their homes and so will not be in positions to take advantage of interest rate cuts, and have fewer collateralizable assets to borrow against to compensate for earnings losses.
Workers in these jobs are also less likely to have access to informal insurance channels that may help them weather the crisis. They are less likely to be married, a status that helps protect household income against individual income risk. They are less likely to be U.S. citizens or born in the United States. Finally, workers in low work-from-home occupations are more likely to have unstable employment; the data show that they are less likely to be employed full-time and more likely to have recently experienced unemployment.
For most of the individual characteristics, the results for low-work-from-home occupations and high-physical-proximity occupations are similar. For example, workers in both high-physical proximity occupations and low-work-from-home occupations are less likely to have a college degree than workers in low-physical-proximity and high-work-from-home occupations, respectively.
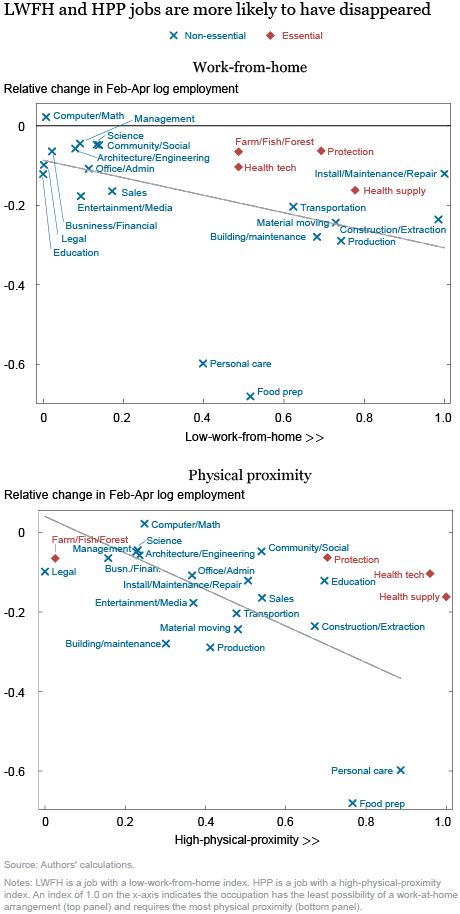
The results quantify how much the most vulnerable disproportionately work in professions that suffer the most from a pandemic lockdown. Labor market data tell us how much worse workers in occupations with LWFH and HPP scores have done in terms of keeping their jobs. We construct excess employment losses using the CPS by taking the change in employment from February to April 2020 relative to the historical average change to account for seasonal factors. The charts below show that LWFH jobs and HPP jobs experienced larger employment losses.
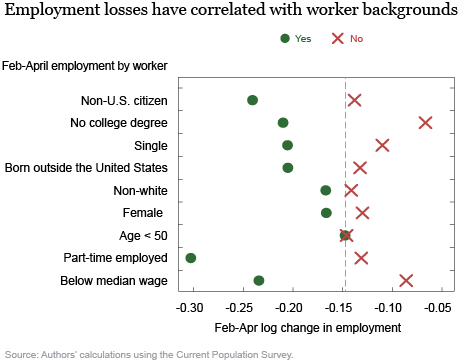
Finally, the data we have collected can also give correlations between worker characteristics and job losses. The chart below shows changes in employment based on worker background. For example, the green dot for non-U.S. citizen says that those with that characteristic saw a 25 percent decline in employment relative to seasonal trends. The red X corresponding to those who are U.S. citizens indicates their employment dropped 15 percent. The characteristics with the largest differential in employment outcomes between groups are citizenship, birth outside the United States, marital status, and education.
Our results, while not surprising, quantify that the most vulnerable have been disproportionately affected by the pandemic because they tend to be clustered in low-work-from-home and high-physical-proximity jobs. This is a challenge for policymakers, since these jobs are likely to be the last ones that come back in the economic recovery.
Simon Mongey is an assistant professor at the University of Chicago Kenneth C. Griffin Department of Economics and a faculty research fellow at the National Bureau of Economic Research.

Laura Pilossoph is an economist in the Federal Reserve Bank of New York’s Research and Statistics Group.
Alexander Weinberg is a research professional in the University of Chicago Department of Economics.
How to cite this post:
Simon Mongey, Laura Pilossoph, and Alex Weinberg, “Which Workers Bear the Burden of Social Distancing Policies?,” Federal Reserve Bank of New York Liberty Street Economics, May 29, 2020, https://libertystreeteconomics.newyorkfed.org/2020/05/which-workers-bear-the-burden-of-social-distancing-policies.html.
Disclaimer
The views expressed in this post are those of the authors and do not necessarily reflect the position of the Federal Reserve Bank of New York or the Federal Reserve System. Any errors or omissions are the responsibility of the authors.




 RSS Feed
 Follow Liberty Street Economics