


While the shocks from COVID-19 were concentrated in a handful of contact-intensive industries, they had rippling effects throughout the economy, which culminated in a considerable decline in U.S. GDP. In this post, we estimate how much of the fall in U.S. GDP during the pandemic was driven by spillover effects from the productivity losses of contact-intensive industries.
Contact-Intensive Industries and COVID-19
Contact-intensive industries, to varying degrees, rely on physical proximity and personal interaction to operate. Within these industries, businesses that were deemed “nonessential” by state and local authorities were temporarily closed, whereas “essential” businesses continued with altered operations. Suspended travel, an uptick in online-ordering services, limited indoor capacities, and remote communication technologies became the new normal. The substantial changes that occurred within these industries ultimately had broader implications for the economy.
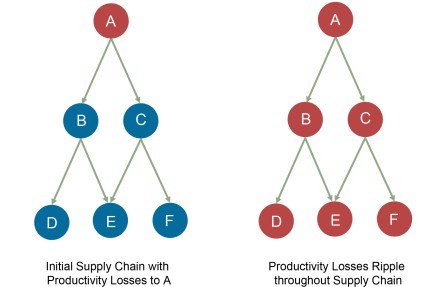
The diagram below illustrates how a productivity shock—such as the one induced by COVID-19—can ripple through the supply chain network. The introduction of a shock to industry “A” is represented with a red circle on the left-hand side. The transition from left to right, or from partially blue to all red, exemplifies how productivity losses to one industry can lead to similar losses in connected industries. For example, changes in the productivity levels of the air travel sector can result in spillover effects that impact sectors that rely on output from the travel industry, such as business services that rely on air transportation.
Spillover Effects of COVID-19 on the Supply Chain Network
Data Sources
To measure the spillover effects from contact-intensive industries, we need to quantify the drop in productivity from COVID-related business changes. Changes in productivity for major sectors of the economy are recorded and released by the U.S. Bureau of Labor Statistics (BLS) on a quarterly basis following GDP estimates. Sector-specific productivity levels for 2020 have been made available by the BLS, but industry-specific productivity data have yet to be released for many industries of interest. As a proxy for this productivity data, we use aggregate mobility data from SafeGraph. The SafeGraph data show anonymized records of foot traffic to points of interest, such as stores or restaurants, in the United States, captured using cell-phone data. For the eight contact-intensive industries shown in the chart below, we calculate the percent change in foot traffic from April 2019 to April 2020, at the height of pandemic shutdowns. We use this change in mobility as a proxy for the COVID-19 productivity shock, since customer foot traffic largely dropped as a result of suspended or reduced business operations. Of course, the change in mobility could be ascribed to reasons other than productivity, such as health outcomes, but the measure is useful as a real-time approximation of productivity.
Pandemic-Related Shocks to Contact-Intensive Industries Induced a Marked Decline in GDP
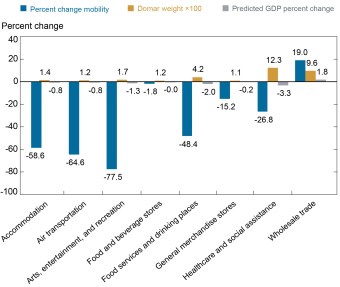
Notes: The percent change in mobility is from April 2019 to April 2020. The Domar weight is multiplied by 100 for visibility and not for computation purposes. The percent change in predicted GDP is the percent change in mobility times the Domar weight.
Macroeconomic Analysis
Gaining a full understanding of how the pandemic’s shock to contact-intensive industries propagated throughout the supply chain would require detailed data on inter-industry transactions in 2020 that are not yet available. Instead, to estimate the approximate effect of COVID-19’s shock to contact-intensive industries on total GDP, we apply Hulten’s theorem. This theorem states that, to a first-order approximation, the effect that a productivity loss in one industry has on aggregate GDP is given by the change in productivity times the industry’s sales as a fraction of GDP output. We use 2019:Q4 data to calculate this fraction, called the Domar weight, in order to capture pre-pandemic production levels.
When constructing these estimates, it is important to note that Hulten’s theorem only provides an approximation. With such a large productivity shock, the nonlinear effects on GDP that are not accounted for by the theorem may be significant, as discussed by Baqaee and Farhi (2019). In addition, this simplified analysis assumes that industries are in a closed economy and treats all firms that are affected by the U.S. service-sector shock as domestic. Since the vast majority of in-person services are provided to domestic firms and consumers, this last observation is unlikely to substantially change our estimates.
According to the Bureau of Economic Analysis, real GDP dropped at an annual rate of 31.4 percent in the second quarter of 2020. Our findings show that shocks to contact-intensive industries induced a decline in GDP of 6.6 percent, which accounts for 21 percent of the observed 31.4 percent drop in GDP. Notably, the healthcare industry, which was one of the hardest hit by the pandemic, faced a 26.8 percent decline in mobility and accounted for a 3.3 percent decline in GDP in our analysis. The drop in GDP comes from both direct and indirect effects, since when hospitals and other healthcare suppliers reduced the number of services they provided in April 2020, other industries also reduced their in-person interactions to avoid unnecessary hospitalizations.
Domar weights, which represent the relative share of the industry in GDP, play an important role in determining the effect of the productivity loss on the macroeconomy. The industries with the largest declines in mobility—accommodation, air transportation, and arts, entertainment, and recreation— actually had among the smallest effects on total GDP. The industry with the largest Domar weight, wholesale trade, increased its productivity, which had disproportionately large and positive effects on predicted GDP. On the other hand, healthcare and food services had substantial negative effects on GDP, contributing the most to the overall 6.6 percent decline in output induced by shocks to contact-intensive industries.
Final Words
The annual decline in GDP in 2020 turned out to be 3.4 percent, much lower than what might be expected from the 32.9 percent decline in 2020:Q2. The recovery was due to multiple factors, including fiscal and monetary stimulus, a gradual reopening of the economy, and changes in supply chains that allowed firms to mitigate some productivity declines even if they could not rely fully on access to healthcare services. These changes in supply chains are explored in a previous Liberty Street Economics blog post.
As more definitive data on the economic effects of COVID-19 are released, there will be more opportunities to study the macroeconomic consequences discussed in this post. More detailed data on the supply chain matrix, for example, would provide insights to how the supply chain changed during the pandemic. It could also provide a view into how non-contact intensive industries were, to the surprise of most economists, able to quickly adjust their supply chain and didn’t face any significant losses in their productivity. Future research will show to what extent these changes contributed to making the COVID-19 recession more moderate than it would otherwise have been.
Victoria E. Agwam was a summer analyst in the Federal Reserve Bank of New York’s Research and Statistics Group.

Pablo D. Azar is an economist in the Bank’s Research and Statistics Group.

Kyra Frye is a senior research analyst in the Bank’s Research and Statistics Group.
Disclaimer
The views expressed in this post are those of the authors and do not necessarily reflect the position of the Federal Reserve Bank of New York or the Federal Reserve System. Any errors or omissions are the responsibility of the authors.
 RSS Feed
 Follow Liberty Street Economics