


The return of U.S. real GDP to its pre-pandemic level in the second quarter of this year was driven by consumer spending on goods. Such spending was well above its pre-pandemic path, while spending on services was well below. Despite the surge in goods spending, domestic manufacturing has increased only modestly, leaving most of the increase in demand being filled by imports. While higher imports have been a drag on growth, the size of this drag has been moderated by the value created by the domestic transportation, wholesale, and retail sectors in selling these goods. Going forward, a rebalancing of consumer spending toward services could give a lift to growth, by shifting demand toward purchases with little import content.
The Pandemic Surge in Demand for Consumer Goods
The pandemic caused a dramatic change in the pace and composition of consumer spending. As shown in the chart below, total consumer spending fell sharply at the onset of the pandemic and rebounded in the following quarters, supported by an influx of government transfer payments. But the mix of spending was quite different from prior to the pandemic. By the third quarter of 2020, spending on goods was up 10 percent relative to spending in 2019—with spending on durables (such as cars, furniture, appliances, and computers) up 16 percent and spending on nondurables (food, gasoline, clothing, and household supplies) up 7 percent. In sharp contrast, spending on services was 7 percent lower, with spending on recreational services down 32 percent.
Consumer Spending Shifted Heavily to Goods during the Pandemic
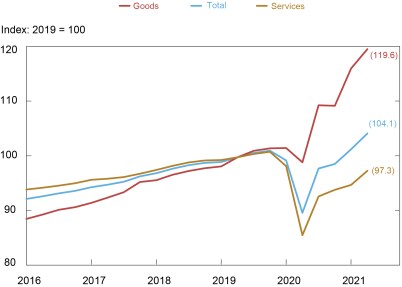
Source: Bureau of Economic Analysis via Haver Analytics.
Total consumer spending was back to near its pre-pandemic trend by the second quarter of 2021, but the shift in the composition of spending persisted, with spending on goods up 20 percent relative to 2019 but spending on services still down 3 percent relative to 2019. The boom in goods spending was broad-based, with purchases of durable goods up 32 percent relative to 2019 and spending on core nondurables (excluding food and energy) up 18 percent.
Imports versus Domestic Production
Imports of consumer goods rose sharply in response to higher demand, while domestic production lagged behind. The chart below compares consumer spending for durables (top panel) and core nondurables (bottom panel) with similar data for imports and U.S. manufacturing. Import volumes for durable consumer goods were up 24 percent in the second quarter of 2021 relative to 2019, not far behind growth in consumer spending. Domestic production of these goods, in contrast, was down slightly. The story is similar for core nondurables. Spending was up a robust 18 percent, while growth in import volumes rose 7 percent. In contrast, domestic production of nondurables was essentially unchanged.
Imports Surged while U.S. Production Lagged
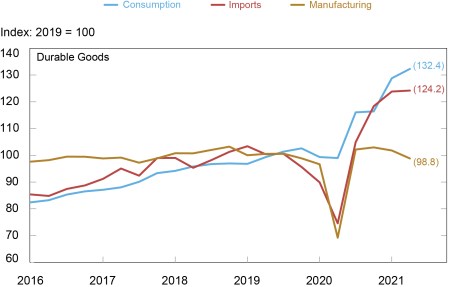
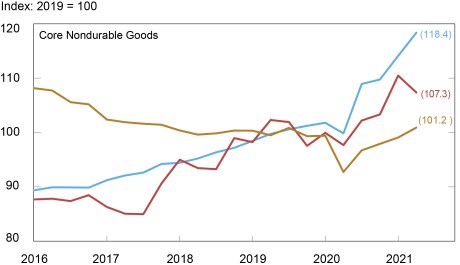
Source: Bureau of Economic Analysis via Haver Analytics.
The lackluster supply response by domestic firms may have been inevitable given the situation prior to the pandemic. U.S. manufacturing capacity is concentrated in the industrial materials and capital goods sectors, leaving U.S. firms relatively poorly positioned to respond directly to the increase in consumer demand. Moreover, the lackluster performance of the consumer goods sector continues a longer trend. Production of both durable and nondurable consumer goods held essentially flat over the five years prior to the pandemic despite strong growth in real spending (an annualized 6.0 and 3.4 percent, respectively).
Imports Are Subtracted from Spending in GDP Calculations
GDP measures value created domestically and can be calculated using data on domestic consumption and investment spending. These spending data do not distinguish domestic and foreign sources of supply, so GDP calculations subtract out imports to arrive at spending on items produced domestically. Similarly, exports are added since they are produced domestically but not captured in domestic spending.
This value-added accounting reveals that a shift in consumer spending from services to goods depresses GDP, for a given overall dollar value of spending. Services are almost entirely produced with domestic labor and capital, while a significant fraction of spending on goods goes to items produced abroad.
There is a partial offset, however, from the value created domestically in bringing goods produced abroad to consumers, a process that involves domestic transportation, warehousing, and retailing activities. Each step generates wage income for U.S. workers and a profit markup for U.S. firms. A study by economists at the Federal Reserve Bank of San Francisco finds somewhat below half the retail price of foreign-produced durable goods and roughly half the retail price of foreign-produced nondurables represents domestic value added.
In this way, the data show that higher consumer goods spending provided a large net boost to GDP, despite the resulting surge in imports. From the fourth quarter of 2019 to the second quarter of 2021, real consumer spending on durable goods rose $520 billion, while imports of these goods rose $150 billion. (These quarterly figures are expressed as annualized values.) Real consumer spending on core nondurables rose $265 billion, while corresponding imports were up just $30 billion. To put these numbers in context, total GDP rose $166 billion over this period, held down by drags from consumer spending on services, investment spending on structures, inventories, and exports.
It is perhaps a puzzle that the increase in imports relative to consumer spending is less than is suggested by the San Francisco Fed study. A partial resolution of this mismatch can be found in inventory developments. At the end of the second quarter of 2021, real inventories were roughly $200 billion below their trend line for the five years prior to the pandemic. And while retail inventories are particularly stretched in the auto sector, the inventory-to-sales ratio for retail outside autos was down 13 percentage points from its pre-pandemic level. This is consistent with anecdotal and survey evidence that retailers have been facing difficulty in obtaining desired goods for sale. Firms’ efforts to rebuild inventories will support growth, but again, any such boost will be partially offset by increasing import volumes.
The Rebalancing Begins
There are signs that a rebalancing in consumer spending is now underway, with spending on goods turning flat and spending on services beginning to regain its lost share. As rebalancing continues, the drag on GDP from higher goods imports and reduced spending on services should start to unwind. Domestic services firms would benefit from this shift, especially in hard-hit sectors such as recreational services. For foreign manufacturers and domestic firms in the transportation, retail, and wholesale sectors, such a shift would be less welcome. Any negative impact from this shift on U.S. manufacturing will likely be fairly limited since these firms did not gain much from the pandemic shift toward consumer goods.

Matthew Higgins is a vice president in the Research and Statistics Group.

Thomas Klitgaard is a vice president in the Federal Reserve Bank of New York’s Research and Statistics Group.
Disclaimer
The views expressed in this post are those of the authors and do not necessarily reflect the position of the Federal Reserve Bank of New York or the Federal Reserve System. Any errors or omissions are the responsibility of the authors.
 RSS Feed
 Follow Liberty Street Economics