


Collateralized loan obligation (CLO) issuances in the United States increased by a factor of thirteen between 2009 and 2019, with the volume of outstanding CLOs more than doubling to approach $647 billion by the end of that period. While researchers and policy makers have been investigating the impact of this growth on the cost and riskiness of corporate loans and the potential implications for financial stability, less attention has been paid to the drivers of this phenomenon. In this post, which is based on our recent paper, we shed light on the role that insurance companies have played in the growth of corporate loans’ securitization and identify the key factors behind that role.
U.S. CLOs Outstanding
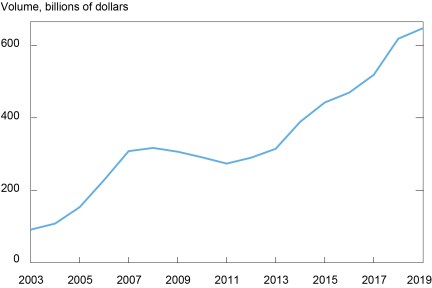
Source: Data come from Moody’s Analytics Structured Finance Portal.
Notes: This chart depicts the time series of the total outstanding volume of CLO tranches denominated in U.S. dollars over the time period 2003-2019 on a yearly basis. The data covers CLOs outstanding up to November 8, 2019.
CLO Investments by Insurance Companies
Insurance companies are known for investing in corporate bonds and syndicated corporate loans. Less understood is their increasing preference for CLOs. Between 2009 and 2019, insurance companies’ investments in corporate bonds went from $1.143 trillion to $1.784 trillion, amounting to a 56 percent increase, while their investments in corporate loans went from $18 billion to $42 billion, or a 132 percent increase. During the same period, their CLO investments went from $13 billion to $125 billion — an 863 percent increase (illustrated in the chart below).
Insurance Companies’ Investments in Corporate Loans, CLOs, and Corporate Bonds over Time
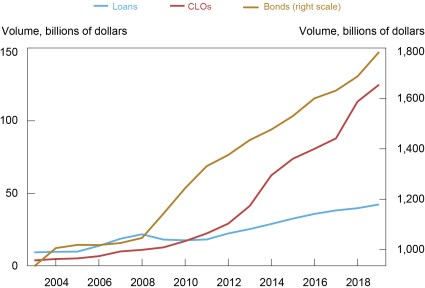
Source: Data come from Schedule D-Part 1 of the annual financial statement filings of life, P&C and health insurance companies submitted to the NAIC and retrieved from SNL Financial.
Notes: This chart depicts the time series of insurance companies’ holdings of corporate loans, CLOs, and corporate bonds as of December 31 of each year during the time period 2003-2019.
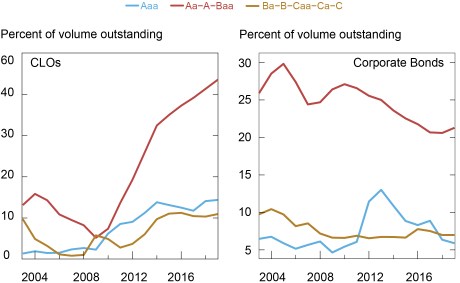
In addition, insurance companies’ CLO investments showed a clear preference for the riskier mezzanine tranches (rated Aa, A or Baa) over the safest, triple-A rated tranches. In 2011, 56 percent of insurance companies’ CLO investments were in triple-A rated tranches while 40 percent were in mezzanine tranches. By 2019, the former had declined to 44 percent while the latter had risen to 52 percent (see the left panel of the chart below). Over the same period, the ratings composition of insurance companies’ bond investments remained mostly unchanged, with 80 percent invested in bonds rated single A or Baa (see the right panel of the chart below).
Composition of Insurance Companies’ Investments in CLOs and Corporate Bonds over Time by Rating
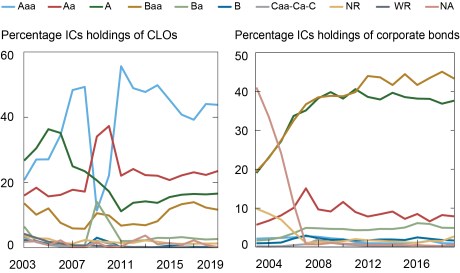
Source: Data come from Schedule D-Part 1 of the annual financial statement filings of life, P&C and health insurance companies submitted to the NAIC and retrieved from SNL Financial, Moody’s Analytics Structured Finance Portal, Mergent Fixed Income Securities Database (FISD) and Moody’s.
Notes: This chart depicts the time series of CLO holdings by credit rating as percentage of the total volume of CLO tranches held by insurance companies (a) and the time series of corporate bond holdings by credit rating as percentage of the total volume of corporate bonds held by insurance companies (b) as of December 31 of each year during the time period 2003-2019.
Reach for Yield by Insurance Companies
Insurers’ proclivity for CLOs vis-à-vis other securities, and for CLO mezzanine tranches within that asset class, reflects a search-for-yield behavior fostered by two features of insurance companies’ capital regulation: first, a coarse definition of risk for capital charges on assets with different credit qualities; second, and in contrast to banking regulation, a similar treatment of different asset classes, such as CLOs and corporate bonds. In particular, insurers assign a National Association of Insurance Commissioners (NAIC) designation (and the associated risk-based capital charge) to each investment according to a mapping from credit ratings. For example, securities rated Aaa, Aa, or A receive the NAIC 1 designation and are subject to a (post-tax) risk-based capital charge of 0.3 percent. Lower credit ratings are associated with higher NAIC designations and risk-based capital weights. While the NAIC 1 designation is mapped to three different credit ratings (Aaa, Aa, A), each of the other NAIC categories is associated with a unique rating. This structure gives insurance companies an incentive to invest in assets with higher yields within a NAIC classification.
The rating-based mapping was partially altered in 2010, when the NAIC enacted a regulatory change that essentially allowed insurance companies to report CLO tranches that were purchased at a discount, or highly impaired, in a lower NAIC category than that implied by the rating-based mapping. The new capital regime for CLO investments likely increased insurance companies’ incentives to invest in higher-yielding CLO tranches.
The following chart presents some evidence consistent with reach-for-yield behavior, particularly since the regulatory reforms of 2010. The left panel shows the time series of insurers’ new CLO holdings falling into the NAIC 1 designation as a percentage of the total volume outstanding of these tranches based on percentiles of the distribution of CLOs yields for each year. As expected, there is a clear preference for the riskiest tranches within NAIC 1 (those with yields above the 66th percentile) throughout the sample period, with the exception of the financial crisis, when all yields are squeezed at their minimum levels. Interestingly, the market shares of CLO tranches with yields above the 33rd percentile experience a sharp increase in the two years following the 2010 regulatory reform, then register a significant drop in 2019, when the reform was repealed. We do not find similar evidence in insurance companies’ corporate bond investments (right panel).
Share of CLOs and Corporate Bonds Held by Insurance Companies by Percentiles of the Distribution of Yields
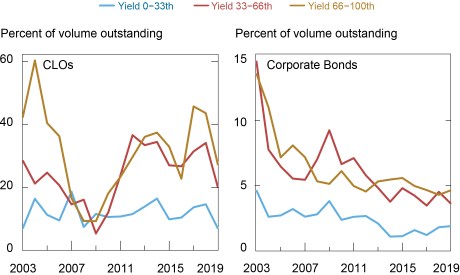
Source: Data come from Schedule D-Part 1 of the annual financial statement filings of life, P&C and health insurance companies submitted to the NAIC and retrieved from SNL Financial.
Notes: This chart depicts the time series of insurers’ new CLO holdings in the NAIC 1 designation bucket as percentage of the total volume outstanding of these CLO tranches based on percentiles of the distribution of CLOs yields reported by insurance companies (a) and the time series of insurers’ new corporate bond holdings in the NAIC 1 designation bucket as percentage of the total volume outstanding of these corporate bonds based on percentiles of the distribution of corporate bonds yields reported by insurance companies (b) as of December 31 of each year during the time period 2003-2019. New CLO holdings and new corporate bond holdings are identified as first-time investments in a given CLO tranche and corporate bond by an insurance company, respectively.
Preference for CLOs by Insurance Companies
Insurers’ search-for-yield behavior translated into a preference for CLOs over corporate bond investments. In the pre-crisis period, when CLO yields were roughly the same as or lower than corporate bond yields, insurance companies purchased a lower portion of CLO tranches compared to corporate bonds with the same rating. But when the yields on CLOs became significantly higher than those on corporate bonds during the financial crisis and, more markedly, during the post-crisis decade, insurance companies exhibited a distinct preference for CLOs over corporate bonds with the same rating.
Insurers’ preference for CLOs had important implications for the CLO market. While their market share of corporate bonds decreased somewhat from 2003 to 2019, their share of CLOs almost quintupled over the same period (see chart below). Importantly, that increase was mostly driven by mezzanine tranches rated investment grade (Aa, A or Baa rated), whose market share increased by a factor of eight (from 5 percent in 2009 to 44 percent in 2019). Also, CLO deals in which insurance companies hold larger investments have larger mezzanine tranches with investment grade ratings, and this has been especially true since the regulatory reforms of 2010.
Insurance Companies’ Market Shares of CLOs and Corporate Bonds
Source: Data come from Schedule D-Part 1 of the annual financial statement filings of life, P&C, and health insurance companies submitted to the NAIC and retrieved from SNL Financial, Moody’s Analytics Structured Finance Portal, Mergent Fixed Income Securities Database (FISD) and Moody’s.
Notes: This chart depicts the time series of the aggregate volume of CLO holdings of insurance companies as percentage of the total volume outstanding of CLO tranches by credit rating (a) and the time series of the aggregate volume of corporate bond holdings of insurance companies as percentage of the total volume outstanding of corporate bonds by credit rating (b) as of December 31 of each year during the time period 2003-2019.
Mezzanine tranches play a critical role in the origination of CLOs because their junior position allows for the creation of the highly sought triple-A tranches. Therefore, insurance companies’ growing preference for these tranches, particularly after 2010, together with their dominant role in the market for these tranches, is likely to have played a key role in the post-2010 growth of corporate loan securitization.

Fulvia Fringuellotti is an economist in the Federal Reserve Bank of New York’s Research and Statistics Group.

João A. C. Santos is a senior vice president in the Bank’s Research and Statistics Group.
Disclaimer
The views expressed in this post are those of the authors and do not necessarily reflect the position of the Federal Reserve Bank of New York or the Federal Reserve System. Any errors or omissions are the responsibility of the authors.
 RSS Feed
 Follow Liberty Street Economics