Houses are the largest asset for most households in the United States, as is the case in many other countries as well. Within countries, there is substantial regional variation in house prices—compare real estate values in Manhattan, New York City, with those in Manhattan, Kansas, for example. But what about returns on investment? Are long-run returns on real estate investment—the sum of price appreciation and rental income flows—higher in superstar cities like New York than in the rest of the country? In this blog post, we present new and potentially surprising insights from research comparing long-run returns on residential real estate in a nation’s largest cities to those experienced in the rest of the country (Amaral et al., 2021), covering the U.S. and fourteen other advanced economies over the past century.
A New Regional Housing Return Database
For the analysis, we compiled a new long-run city-level data set covering annual house prices and rents in twenty-seven large (“superstar”) cities in fifteen OECD countries over the past 150 years. We borrow the “superstar city” terminology from the well-known paper by Gyourko, Mayer, and Sinai (2013) for the U.S., but take it global in the sense that we study the main economic agglomerations in each of these fifteen countries. For each national superstar city, we calculate long-run total returns on residential real estate investments as the sum of price appreciation and rent returns—and compare them to returns in the rest of the country. For the construction of the data set, we partly drew on existing historical research for individual cities. In most cases, however, we hand-collected new house price and rental series from city yearbooks or primary sources such as newspapers, tax records, and notary archives.
The data show that, over the long-run, superstar cities have witnessed lower total returns on residential real estate than other parts of the same country. The table below shows average capital gains, rent returns and total returns for the superstar cities (Column 1) and for the national housing portfolios as defined in Jordà et al. (2019) (Column 2). Column (4) shows the implied population-weighted return for the rest of the country, excluding the superstars.
City-Level and National Yearly Housing Returns (Log Points), 1950-2018
27 National Superstars
| Cities | National | Difference | RoC | Diff. to RoC | |
|---|---|---|---|---|---|
| Capital gain | 2.25 | 1.82 | 0.43* (0.23) | 1.64 | 0.61** (0.26) |
| Rent return | 3.55 | 4.94 | -1.39*** (0.04) | 5.21 | -1.65*** (0.05) |
| Total return | 5.72 | 6.68 | -0.95*** (0.23) | 6.76 | -1.04*** (0.26) |
| N | 1767 |
Notes: The table shows averages of city-level and national log capital gains, log rent returns and log housing returns as well as the differences. National return averages are weighted by the number of cities in the respective country in the sample. Standard errors of differences (in parenthesis) and significance stars are calculated using paired t-tests. Rest of country (RoC) returns are calculated as national housing portfolio returns share after taking out the returns of the 27 national superstars. We use previous year population shares as weights of the portfolio share of our cities, such that the estimate should be interpreted a lower bound. ∗ : p < 0.1; ∗∗ : p < 0.05; ∗∗∗ : p < 0.01.
While house prices have grown faster in the large cities, the rental returns are substantially higher in more remote locations, leading to overall higher returns in the rest of the country. Average total returns have been 5.75 log points per year in the national superstars, compared to the national average of 6.68 log points. In other words, an investment in the most important cities within a country comes with a negative return premium of approximately 90-100 basis points relative to national average returns. We call this the negative “superstar premium.” The return differences are a robust feature of the data across countries and time periods, and statistically highly significant. A negative return premium of around 1 percentage point accumulates to substantial return differences in the long run. For instance, an investment in the superstar portfolio earned only about half the cumulative return of the national average portfolio over the past 70 years.
Housing Returns over the City-Size Distribution in the U.S.
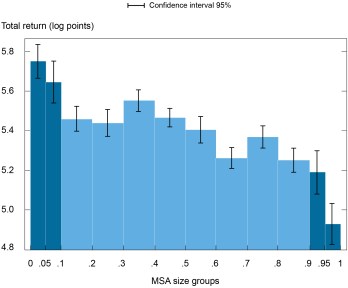
To better understand the negative superstar premium we take a closer look at the U.S. housing market, for which we have comprehensive return data across the entire city-distribution since 1950. We combine the data compiled by Gyourko, Mayer, and Sinai (2013) with data from the American Community Survey for the 2010-18 period. The chart below shows average log total returns by increasing MSA size for the U.S. The key result is that in the postwar U.S., total returns to housing decrease with city size. There is an almost monotonic negative relation between total returns and city size with the biggest differences between the largest and smallest MSAs. We calculate a return premium of small vs. large MSAs in the U.S. of about 80 basis points annually. This estimate is statistically highly significant.
Total Returns for 316 MSAs in the U.S. (Log Points) by Population Size, 1950-2018

Notes: All returns are log returns. Cities are divided into bins based on the size of MSA population in 1950. The middle 8 bins cover size deciles 2 to 9. The 4 extreme bins split the smallest and largest deciles in half.
Risk and Return
Why are housing returns lower in large cities than in the rest of the country? Our key finding can be rationalized in a standard asset pricing framework where excess returns are a compensation for higher risk. Observable long-run return differences between different assets must be attributable to differences in risk, or to violations of standard assumptions (such as behavioral biases in expectations).
Now suppose that everything that makes a national superstar city–its diversified economy, its large market, its amenities, the international demand (Black and Henderson (1999), Desmet and Henderson (2015))–also makes it a safer place as an investment. A consequence would be that the present value of future housing services will be subject to less risk so that buyers are willing to pay a higher price and accept a lower return for housing investments in large agglomerations. In turn, higher returns outside the superstars would be compensation for higher risk. For remote locations to attract capital, they have to offer higher returns.
There is empirical evidence for differences in housing risk across locations. On the one hand, the co-variance between housing returns and income growth is lower in large cities. The table below shows the differences in the co-variance between large and small MSAs for the U.S. The co-variance between MSA-level income growth and MSA-level housing returns has been significantly larger in smaller MSAs.
Differences in Co-Variances between Income and Housing Returns by City Size, U.S, 1950-2018
| Sample | Capital Gain | Rental Yield | Total Return | N |
|---|---|---|---|---|
| Large vs rest | -0.68** (0.317) | -0.65*** (0.126) | -0.75** (0.298) | 316 |
| Large vs small | -2.00*** (0.606) | -1.23*** (0.250) | -2.25*** (0.584) | 31 |
Notes: The table shows differences in the co-variance between income growth and log excess total returns, log excess capital gains and log excess rental yields between large MSAs and the rest of the sample or small MSAs. Differences are measured as coefficients in a cross-sectional regression of the dependent variable (co-variance) on a large MSA dummy. Robust standard errors in parenthesis. Large MSAs are defined as being at or above the 95th percentile of the MSA population distribution in 1950. The second row shows the same, but comparing large MSAs only to small MSAs, which are defined as being at or below the 5th percentile of the MSA population distribution in 1950. Overall, we use estimates for 316 MSAs between 1950 and 2018. ∗ : p < 0.1; ∗∗ : p < 0.05; ∗∗∗ : p < 0.01.
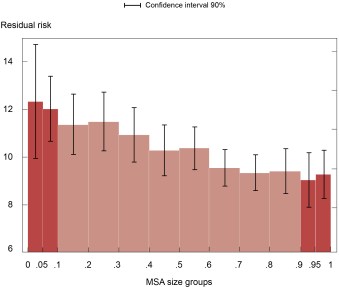
On the other hand, households are also exposed to other risks such as lower liquidity outside large cities. Using U.S. transaction-level data from Corelogic, one can show that this so-called idiosyncratic component of housing risk decreases with MSA size. In the chart below we plot average house-specific risk by MSA size for the period between 1990 and 2020. Similar to the patterns we found for housing returns, idiosyncratic risk seems to decrease almost monotonically with MSA size. As liquidity is low, homeowners in thinner markets face a greater risk of not realizing the local market return at the point of sale. Real estate search engine data confirm a significant increase of housing liquidity with city size. These findings mesh nicely with recent work by Giacoletti (2021), Sagi (2021), and Kotova and Zhang (2019), who show a strong relationship between house-specific risk and housing market liquidity.
Annual Idiosyncratic House Price Risk by MSA Size in the U.S., 1990-2020

Notes: The chart shows average annual idiosyncratic house price risk for different MSA size groups for the period between 1990 and 2020. MSAs are divided into bins based on the size of MSA population in 1990. The middle 8 bins cover size deciles 2 to 9. The 4 extreme bins split the smallest and largest deciles in half. All series are real and annualized.
Conclusion
Houses are the most important asset for families. They typically hold nondiversified real estate assets in specific locations. The distribution of housing returns across space therefore plays a central for household finance and consumption, the evolution of household wealth and its distribution, as well as financial stability risks. Our study takes the first steps toward a better understanding of spatial risk and return patterns in housing markets over the long run.
In particular, this blog post presented a novel data set covering housing return series for twenty-seven superstar cities. The key finding across international and U.S. data is that the big cities tend to underperform the rest of the country in terms of total returns. On average, investments in residential real estate in a national superstar city (such as New York, London, or Paris) yielded lower returns than investments in the rest of the country. Investors buying real estate outside of the large cities earned higher returns. The reason is that superstar real estate is comparatively safe. The returns are less strongly correlated with income growth, and market liquidity is higher, leading to lower sales price uncertainty. Higher returns outside the big agglomerations are a compensation for higher risks.
Francisco Amaral is a professor at the University of Bonn.
Martin Dohmen is a professor at the University of Bonn.
Sebastian Kohl is a senior researcher at the Max Planck Institute for the Study of Societies, Cologne.

At the time this post was written, Moritz Schularick was an assistant vice president in the Federal Reserve Bank of New York’s Research and Statistics Group. He is currently a professor of economics at the University of Bonn.
Related reading:
Mapping Home Price Changes
References:
Francisco Amaral, Martin Dohmen, Sebastian Kohl, and Moritz Schularick (2021), Superstar Returns, Federal Reserve Bank of New York Staff Reports, no. 999, December 2021
Disclaimer
The views expressed in this post are those of the authors and do not necessarily reflect the position of the Federal Reserve Bank of New York or the Federal Reserve System. Any errors or omissions are the responsibility of the authors.


 RSS Feed
 Follow Liberty Street Economics