


This post presents an update of the economic forecasts generated by the Federal Reserve Bank of New York’s dynamic stochastic general equilibrium (DSGE) model. We describe very briefly our forecast and its change since December 2021. As usual, we wish to remind our readers that the DSGE model forecast is not an official New York Fed forecast, but only an input to the Research staff’s overall forecasting process. For more information about the model and variables discussed here, see our DSGE model Q & A.
The March 2022 model forecast is reported in the table below, alongside the one from December 2021, and depicted in the charts that follow. The forecast uses quarterly macroeconomic data released through 2021:Q4, augmented for 2022:Q1 with the median forecasts for real GDP growth and core PCE inflation from the February Survey of Professional Forecasters release, as well as the yields on 10-year Treasuries and Baa corporate bonds based on 2022:Q1 averages up to February 25.
The model projects an increase in GDP growth from 0.9 percent in 2022 to 1.2 percent in 2023, followed by a gradual rise over the forecast horizon, reaching 1.8 percent by 2025. Compared to December, the model forecasts somewhat weaker GDP growth in 2022 (0.9 percent now versus 1.6 percent in December) followed by a slightly faster rate of growth thereafter. The model projects that core PCE inflation will stand at 2.8 percent in 2022, an upward revision of 0.6 percentage point relative to the December forecast. This change reflects higher inflation in 2021:Q4 and 2022:Q1 than projected in December. Core PCE inflation is forecasted to ease to 2.2 percent in 2023, marginally stronger than the December projection, and to fall further to the mandate-consistent level of 2 percent in 2024 and 2025.
Changes in the near-term forecasts for GDP growth and core PCE inflation relative to December reflect two main factors. The first is a continuation of the cost-push shocks that have prevailed over 2021. These shocks result in higher inflation and lower output growth projections in 2022 but their effect wanes over time, leading inflation to return to 2 percent. The second factor is tighter monetary policy in 2022 and 2023, with the federal funds rate lifting off the effective lower bound (ELB) in the first quarter of 2022, rather than in the fourth quarter of 2022 as in the December projection.
The model assumes that monetary policy follows a version of average inflation targeting (AIT), reflecting the changes in the FOMC monetary policy strategy announced in August 2020. The parameters of the AIT rule are calibrated such that after liftoff the federal funds rate is increasing broadly in line with expectations among market participants.
Estimates of the real natural rate of interest and its future evolution are broadly similar to those in December, with the natural rate predicted to be zero by the end of 2022 and to rise to 0.6 percent by the end of 2025. Partly reflecting the somewhat tighter path of policy in the short run, the output gap is estimated to be more negative than in December, hovering around -1 percent throughout the forecast horizon. While uncertainty surrounding the projections for all variables remains sizeable, the 68th percentiles for the core PCE inflation projections remain 3.1 percent or below from 2023 through 2025.
Forecast Comparison
| 2022 | 2023 | 2024 | 2025 | |||||
|---|---|---|---|---|---|---|---|---|
| Mar | Dec | Mar | Dec | Mar | Dec | Mar | Dec | |
| GDP growth (Q4/Q4) | 0.9 (-0.8, 2.6) |
1.6 (-0.5, 3.7) |
1.2 (-0.6, 3.1) |
1.2 (-0.7, 3.1) |
1.5 (-0.3, 3.4) |
1.4 (-0.5, 3.3) |
1.8 (-0.1, 3.6) |
1.6 (-0.3, 3.4) |
| Core PCE inflation (Q4/Q4) | 2.8 (2.1, 3.6) |
2.2 (1.4, 3.0) |
2.2 (1.3, 3.1) |
2.0 (1.1, 2.9) |
2.0 (1.1, 3.0) |
2.0 (1.1, 3.0) |
2.0 (1.0, 3.0) |
2.1 (1.1, 3.1) |
| Real natural rate of interest (Q4) | 0.0 (-1.3, 1.4) |
0.2 (-1.2, 1.6) |
0.4 (-1.1, 1.9) |
0.4 (-1.1, 2.0) |
0.6 (-1.0, 2.1) |
0.5 (-1.1, 2.2) |
0.6 (-1.1, 2.3) |
0.6 (-1.1, 2.3) |
Notes: This table lists the forecasts of output growth, core PCE inflation, and the real natural rate of interest from the March 2022 and December 2021 forecasts. The numbers outside parentheses are the mean forecasts, and the numbers in parentheses are the 68 percent bands.
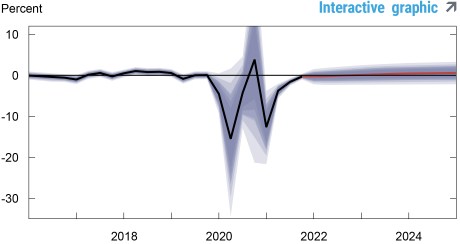
Forecasts of Output Growth
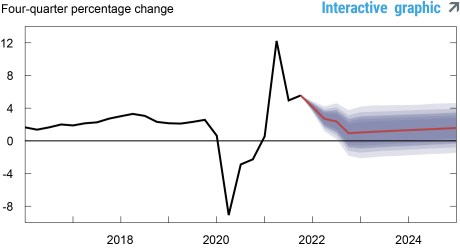
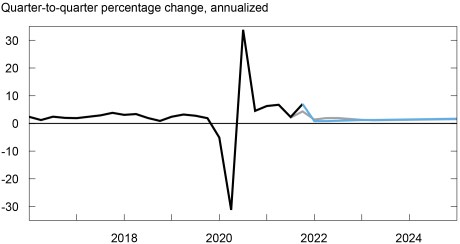
Notes: These two panels depict output growth. In the top panel, the black line indicates actual data and the red line shows the model forecasts. The shaded areas mark the uncertainty associated with our forecasts at 50, 60, 70, 80, and 90 percent probability intervals. In the bottom panel, the blue line shows the current forecast (quarter-to-quarter, annualized), and the gray line shows the December 2021 forecast.
Forecasts of Inflation
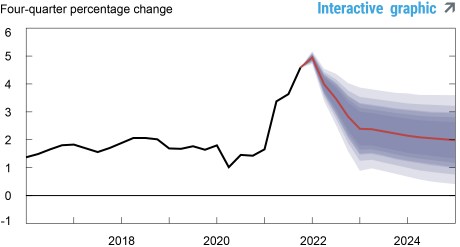
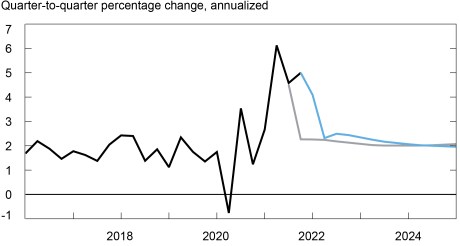
Notes: These two panels depict core personal consumption expenditures (PCE) inflation. In the top panel, the black line indicates actual data and the red line shows the model forecasts. The shaded areas mark the uncertainty associated with our forecasts at 50, 60, 70, 80, and 90 percent probability intervals. In the bottom panel, the blue line shows the current forecast (quarter-to-quarter, annualized), and the gray line shows the December 2021 forecast.
Real Natural Rate of Interest
Notes: The black line shows the model’s mean estimate of the real natural rate of interest; the red line shows the model forecast of the real natural rate. The shaded area marks the uncertainty associated with the forecasts at 50, 60, 70, 80, and 90 percent probability intervals.

Ozge Akinci is a senior economist in the Federal Reserve Bank of New York’s Research and Statistics Group.

Marco Del Negro is a vice president in the Bank’s Research and Statistics Group.

Aidan Gleich is a senior research analyst in the Bank’s Research and Statistics Group.

Shlok Goyal is a senior research analyst in the Bank’s Research and Statistics Group.

Alissa Johnson is a senior research analyst in the Bank’s Research and Statistics Group.

Andrea Tambalotti is a vice president in the Bank’s Research and Statistics Group.
How to cite this blog post:
Ozge Akinci, Marco Del Negro, Aidan Gleich, Shlok Goyal, Alissa Johnson, and Andrea Tambalotti, “The New York Fed DSGE Model Forecast—March 2022,” Federal Reserve Bank of New York Liberty Street Economics, March 18, 2022, https://libertystreeteconomics.newyorkfed.org/2022/03/the-new-york-fed-dsge-model-forecastMarch-2022.
Disclaimer
The views expressed in this post are those of the authors and do not necessarily reflect the position of the Federal Reserve Bank of New York or the Federal Reserve System. Any errors or omissions are the responsibility of the authors.
 RSS Feed
 Follow Liberty Street Economics