


Authors’ note: This analysis was conducted prior to the August announcement of the federal student loan forgiveness policy from the White House. Find an updated analysis detailing the White House plan here.
The pandemic forbearance for federal student loans was recently extended for a sixth time—marking a historic thirty-month pause on federal student loan payments. The first post in this series uses survey data to help us understand which borrowers are likely to struggle when the pandemic forbearance ends. The results from this survey and the experience of some federal borrowers who did not receive forbearance during the pandemic suggest that delinquencies could surpass pre-pandemic levels after forbearance ends. These concerns have revived debates over the possibility of blanket forgiveness of federal student loans. Calls for student loan forgiveness entered the mainstream during the 2020 election with most proposals centering around blanket federal student loan forgiveness (typically $10,000 or $50,000) or loan forgiveness with certain income limits for eligibility. Several studies (examples here, here, and here) have attempted to quantify the costs and distribution of benefits of some of these policies. However, each of these studies either relies on data that do not fully capture the population that owes student loan debt or does not separate student loans owned by the federal government from those owned by commercial banks and are thus not eligible for forgiveness with most proposals. In this post, we use representative data from anonymized credit reports that allows us to identify federal loans, calculate the total cost of these proposals, explore important heterogeneity in who owes federal student loans, and examine who would likely benefit from federal student loan forgiveness.
This analysis offers a granular look at outcomes under various policy options. We find that smaller forgiveness policies distribute a greater share of benefit to borrowers with low- and mid-range credit scores and residing in low- and middle-income neighborhoods. Increasing the per-borrower maximum forgiveness shifts larger shares of forgiven debt to higher credit score borrowers and higher income neighborhoods. By contrast, limiting forgiveness eligibility by income reduces the total cost of the policy while distributing larger shares of forgiveness to low- and middle-income neighborhoods, low- and mid-credit score borrowers, and majority minority neighborhoods.
Data and Definitions
We use the New York Fed/Equifax Consumer Credit Panel (CCP) which is a nationally representative 5 percent sample of all U.S. adults with a credit report. We directly observe a borrower’s age, credit score, and student loan balance, but we do not observe an individual’s income or demographic information. Instead, we use Census block group identifiers from the CCP to match an individual to information about their neighborhood, such as median household income and demographics, from the five-year American Community Survey 2014-2018. We identify student loans that are held by the federal government by selecting loans that entered automatic administrative forbearance at the beginning of the COVID-19 pandemic. These include Direct loans that were disbursed by the federal government and loans originally disbursed through the Family Federal Education Loan (FFEL) Program but were subsequently consolidated into the Direct program or sold to the federal government. These also include loans disbursed from either the Direct or FFEL program that are in default.
Costs of Forgiveness Policies
We estimate the total cost of federal loan forgiveness policies by calculating the dollar value of the loans that would be forgiven under each policy. We limit the sample of loans eligible for forgiveness to only those owned by the federal government since this has been the focus of most cancellation proposals. The total outstanding balance for federally-owned (including defaulted) student loans in December 2021 was $1.38 trillion. Limiting forgiveness to a maximum of $50,000 per borrower would cost $904 billion and would forgive the full balance for 29.9 million (79 percent) of the 37.9 million federal borrowers, resulting in an average forgiveness of $23,856 per borrower. This threshold would also forgive 77 percent of all federal student loans that were delinquent or in default prior to the pandemic. Meanwhile, forgiveness of $10,000 per borrower would forgive a total of $321 billion of federal student loans, eliminate the entire balance for 11.8 million borrowers (31.1 percent), and cancel 30.5 percent of loans delinquent or in default prior to the pandemic forbearance. Under this policy, the average borrower would receive $8,478 in student loan forgiveness.
Next, we explore the impact of adding income limits for determining eligibility for forgiveness. Since we do not directly observe a borrower’s income, we simulate eligibility by sampling from the distribution of household income for each borrower’s Census block group and take the average total forgiveness over 100 simulations. Adding a household income limit of $75,000 reduces the total cost of a $50,000 forgiveness policy from $904 billion to $507 billion, a reduction of almost 45 percent. Similarly, the same income limit reduces the cost of a $10,000 forgiveness policy from $321 billion to $182 billion.
One caveat is that the estimate for the cost of potential student loan forgiveness policies is likely the upper bound. Specifically, some of the balances forgiven under these hypothetical blanket policies will eventually be forgiven under the Public Service Loan Forgiveness (PSLF) program or through income-driven repayment plans. For these loans, the net cost of blanket forgiveness now would not be the total outstanding amount of each loan (as we calculate) but instead would be the stream of monthly payments on these loans until they are cancelled under existing forgiveness policies.
Who Benefits from Forgiveness?
BY AGE
We begin by studying who holds federal student loan balances and who would receive forgiveness by age under the various policies. Sixty-seven percent of student loan borrowers are under 40, however only 57 percent of balances are owed by those under 40, showing that those with larger balances are more likely to be older (likely due to borrowing for graduate school). Under each of the considered policies (forgiveness at the $10,000 or the $50,000 level, with and without income caps), over 60 percent of forgiven loan dollars benefit those under 40 years old. While income caps do not significantly change the share of forgiveness going to each age group, increasing the forgiveness amount from $10,000 to $50,000 shifts a larger share of forgiven debt to older borrowers. However, those over 60 years old benefit the least from forgiveness. Despite being 32 percent of the U.S. adult population, those 60 and older only receive around 6 percent of forgiven dollars, roughly in line with the share of this age group that owes federal student loans.
Student Loan Forgiveness Predominately Benefits Those Under 40
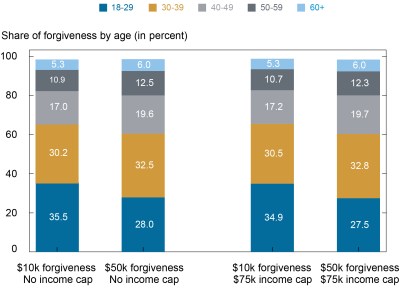
Note: Total shares for each policy may not sum to 100 percent due to rounding or missing identifiers.
By Neighborhood Income
Next, we study who benefits from student loan forgiveness by income. Since we do not directly observe income for individuals in the data, we assign individuals to an income category by the median income of their neighborhood through Census block group designations. We split income into quartiles with the lowest quartile defined as low-income (with a median annual income below $46,310), the middle two quartiles as middle-income (between $46,310 and $78,303 per year), and the highest quartile as high-income ($78,303 and above per year). Borrowers living in high-income areas are more likely to owe federal student loans and hold higher balances. Despite being 25 percent of the population, borrowers who live in high-income neighborhoods hold 33 percent of federal balances while borrowers residing in low-income areas hold only 23 percent of balances. Under both forgiveness levels without income caps, low-income neighborhoods receive roughly 25 percent of debt forgiveness while high-income neighborhoods receive around 30 percent of forgiveness. Increasing the threshold from $10,000 to $50,000 results in a marginally larger share of forgiveness to high-income areas. The average federal student loan borrower living in a high-income neighborhood would receive $25,054 while the average borrower living in a low-income neighborhood would receive $22,512. By contrast, adding a $75,000 income cap for forgiveness eligibility significantly shifts the share of benefits. The share of forgiven dollars going to high-income areas falls from around 30 percent to around 18 percent and the share of forgiven debt going to low-income areas increases from around 25 percent to around 34 percent.
Increasing Student Loan Forgiveness Distributes a Larger Share of Benefits to Higher-Income Neighborhoods, but Income Caps Counterbalance this Trend
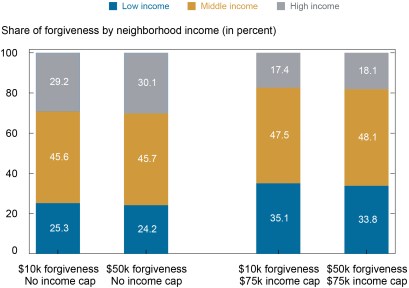
Notes: We assign individuals to an income category by the median income of their neighborhood through Census block group designations. The low-income group represents those with a neighborhood income median below $46,310 per year, the middle-income group between $46,310 and $78,303, and the high-income group $78,303 or more. Total shares for each policy may not sum to 100 percent due to rounding or missing identifiers.
By Credit Score
We also track the share of federal student loan forgiveness that would benefit people with different levels of financial stability by categorizing them into credit score bins. Credit scores serve as a proxy for both income and financial stability so borrowers with lower credit scores are more likely to struggle with payments while borrowers with higher scores are more likely to be of higher income and more financially stable. We use credit scores from February 2020 since previously delinquent federal student loan borrowers experienced large credit score increases when their accounts were marked current due to pandemic forbearance. Compared to the population of U.S. adults with a credit report, student loan borrowers have substantially lower credit scores. Roughly 34 percent of all credit scores are greater than 760, but only 11 percent of student loan borrowers have these super prime scores. When weighted by balance, student loan borrowers have higher scores suggesting that those with high balances also have higher credit scores. Under all four policies, more than half the share of forgiven debt would go to borrowers with a credit score below 660. As with our analysis by income, increasing the threshold from $10,000 to $50,000 increases the share of forgiven balances going to those with credit scores of 720 or higher, suggesting that a higher per borrower forgiveness amount tends to benefit borrowers of higher socioeconomic status more. However, income caps reduce the share of benefits going to those with super prime scores and distributes a larger share of forgiveness to those with lower credit scores.
Most Forgiven Debt Would Go to Student Loan Borrowers with Lower Credit Scores
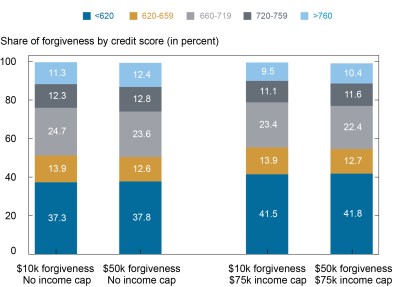
Note: Total shares for each policy may not sum to 100 percent due to rounding or missing identifiers.
By Neighborhood Demographics
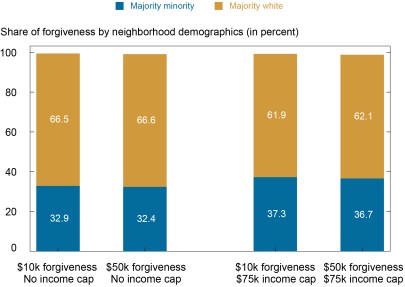
We next examine who benefits from forgiveness based on demographic characteristics of a borrower’s neighborhood. We separate borrowers into two categories: those who live in a Census block group with more than 50 percent of residents identifying as white non-Hispanic (majority white) and those who live in a Census block group with at most 50 percent white non-Hispanic residents (majority minority). Those living in majority white and majority minority neighborhoods are equally likely to owe student loans; roughly 67 percent of the population and 67 percent of federal student loan borrowers reside in majority white neighborhoods and balance shares are split roughly in the same proportion. Under a $10,000 forgiveness policy, 33 percent of forgiveness would go to majority minority neighborhoods while 67 percent would go to majority white neighborhoods. Further increasing forgiveness from $10,000 to $50,000 does not significantly change these shares. However, introducing an income cap of $75,000 for eligibility significantly increases the share of forgiven loans going to majority minority neighborhoods—from roughly 33 percent of forgiven debt to 37 percent at both forgiveness levels.
Income Caps Shift a Larger Share of Forgiven Student Loans to Majority Minority Neighborhoods
Notes: We separate borrowers into two categories: those who live in a Census block group with at most 50 percent white non-Hispanic residents (majority minority) and those who live in a Census block group with more than 50 percent of residents identifying as white non-Hispanic (majority white). Total shares for each policy may not sum to 100 percent due to rounding or missing identifiers.
Conclusion
In this post, we examine who benefits from various federal student loan forgiveness proposals. In general, we find that smaller student loan forgiveness policies distribute a larger share of benefits to lower credit score borrowers and to those that live in less wealthy and majority minority neighborhoods (relative to the share of balances they hold). Increasing the forgiveness amount increases the share of total forgiven debt for higher credit score borrowers and those living in richer neighborhoods with a majority of white residents.
We find that adding an income cap to forgiveness proposals substantially reduces the cost of student loan forgiveness and increases the share of benefit going to borrowers who are more likely to struggle repaying their debts. A $75,000 income cap drops the cost of forgiveness by almost 45 percent for either a $10,000 or $50,000 policy. Further, it drastically changes the distribution of benefits. Under a $10,000 policy, an income cap raises the share of forgiven loan dollars going to borrowers in low-income neighborhoods from 25 percent to 35 percent and the share going to lower credit score borrowers from 37 percent to 42 percent. Income caps also increase the share of loans forgiven that were delinquent prior to the pandemic. Adding an income cap to a $10,000 policy increases the share of forgiveness canceling loans that were delinquent before the pandemic from 34 percent to 60 percent. Under any policy, means testing would more directly target forgiveness to borrowers facing a greater struggle with repayment, which would result in a significantly less regressive policy.

Jacob Goss is a senior research analyst in the Federal Reserve Bank of New York’s Research and Statistics Group.

Daniel Mangrum is an economist in the Bank’s Research and Statistics Group.

Joelle Scally is a senior data strategist in the Bank’s Research and Statistics Group.
How to cite this post:
Jacob Goss, Daniel Mangrum, and Joelle Scally, “Who Are the Federal Student Loan Borrowers and Who Benefits from Forgiveness?,” Federal Reserve Bank of New York Liberty Street Economics, April 21, 2022, https://libertystreeteconomics.newyorkfed.org/who-are-the-federal-student-loan-borrowers-and-who-benefits-from-forgiveness/.
Disclaimer
The views expressed in this post are those of the authors and do not necessarily reflect the position of the Federal Reserve Bank of New York or the Federal Reserve System. Any errors or omissions are the responsibility of the authors.
Disclosure
An author owes federal student loans that could be cancelled under some of these policies.
 RSS Feed
 Follow Liberty Street Economics