


The Russian invasion of Ukraine increased uncertainty around the world. Although most U.S. companies have limited direct exposure to Ukrainian and Russian trading partners, increased global uncertainty may still have an indirect effect on funding conditions through tightening financial conditions. In this post, we examine how conditions in the U.S. corporate bond market have evolved since the start of the year through the lens of the U.S. Corporate Bond Market Distress Index (CMDI). As described in a previous Liberty Street Economics post, the index quantifies joint dislocations in the primary and secondary corporate bond markets and can thus serve as an early warning signal to detect financial market dysfunction. The index has risen sharply from historically low levels before the invasion of Ukraine, peaking on March 19, but appears to have stabilized around the median historical level.
CMDI Is a Unified Measure of Market Functioning
The CMDI combines information on various aspects of functioning of both the primary and secondary markets for U.S. corporate bonds into a single metric, as described in detail in our staff report. Ranging from 0 to 1, a higher level of CMDI corresponds with historically extreme levels of dislocation. The chart below plots the evolution of the CMDI since the start of the year, with event lines at February 24 (the start of the invasion of Ukraine) and March 16 (date of the March Federal Open Market Committee [FOMC] meeting at which the target range of the federal funds rate was raised for the first time since 2019). The CMDI started 2022 at historically low levels—below the fifth percentile—suggesting that conditions in both primary and secondary markets for corporate bonds were at historically accommodative levels. The chart shows that the rise in global uncertainty precipitated by the invasion of Ukraine corresponded to a rapid increase in the CMDI, which peaked at the sixty-first percentile in the week ending on March 19 but has subsequently retraced to the twenty-third percentile in the week ending on May 28.
The CMDI increased rapidly following invasion of Ukraine but has since stabilized
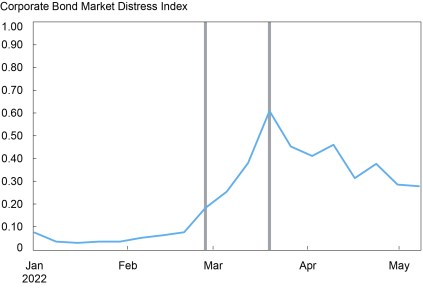
Notes: CMDI is Corporate Bond Market Distress Index. The event line on February 24 corresponds to the start of the Russian invasion of Ukraine and the one for March 16 corresponds to the date of the March Federal Open Market Committee meeting.
In addition to examining how conditions have changed in the corporate bond market overall, we can also compare the differential changes in conditions for investment-grade bonds—that is, those rated Baa-/BBB- or above—and high-yield bonds. The next chart shows that market functioning deteriorated considerably more for investment-grade bonds, peaking at the seventy-fourth percentile in the week ending on March 19. While the increases in global uncertainty coincided with monetary policy tightening, the larger deterioration in market functioning for investment-grade bonds is suggestive that uncertainty may have played a bigger role than monetary policy in the evolution of functioning for the overall market. Market conditions for higher-rated corporate bonds are less sensitive to changes in monetary policy than those for high-yield bonds; for example, because the average maturity for high-yield bonds is shorter—increasing the probability that high-yield issuances will be refinanced at higher interest rates.
Market functioning deteriorated more rapidly for investment-grade bonds
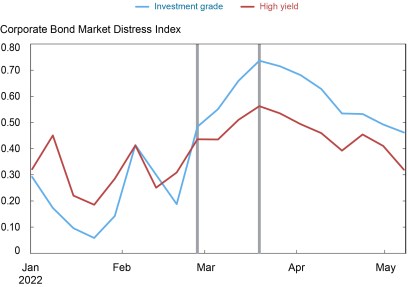
Notes: CMDI is Corporate Bond Market Distress Index. The event line on February 24 corresponds to the start of the Russian invasion of Ukraine and the one for March 16 corresponds to the date of the March Federal Open Market Committee meeting.
What Is Driving the Recent Movements in the CMDI?
To further understand what has been driving the recent changes in the CMDI, we turn to the contributions from the six underlying sub-indices—secondary market volume, secondary market liquidity, secondary market duration-matched spreads, secondary market default-adjusted spreads, primary market issuance, and the spread between primary and secondary market pricing—to the level of the CMDI-squared. The way the CMDI is constructed, the square of the index can be written as the sum of contributions from the individual sub-indices. The next chart shows that, although a slowdown in issuance was the most noticeable contributor to the level of the CMDI at the beginning of 2022, the deterioration following the February 24 invasion of Ukraine can be initially attributed to trading conditions in the secondary market, with a decline in average trade size and the buy-sell ratio and an increase in turnover. The peak in the week ending on March 19 coincided with a deterioration in the default-adjusted spread sub-index, suggesting greater risk compensation for bearing default risk, and a deterioration in the spread between primary and secondary market pricing, suggesting a reduced willingness by market participants to intermediate in the primary market for U.S. corporate debt.
Both primary and secondary market conditions drive changes in the CMDI

Notes: This chart illustrates contributions from the six underlying sub-indices of the Corporate Bond Market Distress Index (CMDI)—secondary market volume, secondary market liquidity, secondary market duration-matched spreads, secondary market default-adjusted spreads, primary market issuance, and the spread between primary and secondary market pricing (PM-SM spread)—to the level of the CMDI-squared.
Overall, this chart highlights the wealth of information encoded in the CMDI. By combining information from both the primary and the secondary market, the CMDI is better able to capture the overall market functioning. Deteriorations in the CMDI are not driven by secondary market credit spreads or secondary market liquidity alone but rather reflect the balance of conditions in both the primary and the secondary market.
Monetary Policy Tightening and Corporate Bond Market Conditions
While we have focused so far on the potential impact of the rise of global uncertainty, the stance of monetary policy and market participants’ perceptions of the stance of monetary policy have also shifted during this period. The FOMC voted to increase the target range for the federal funds rate at the March 15-16 FOMC meeting and financial market participants anticipate ongoing rate increases over coming FOMC meetings (see here). A natural question to ask in this context is how much of the changes in the CMDI can be attributed to monetary policy rather than global uncertainty. The charts above show that the functioning of investment-grade market deteriorated more rapidly than that of the high-yield market, and that the initial deteriorations in the overall index were primarily driven by measures of secondary market volume rather than spreads, both of which suggest that at least the initial deterioration of market functioning between February 19 and March 19 is unlikely to have been driven by monetary policy. An alternative approach to evaluating this question is to compare the recent evolution in the CMDI to the evolution in the CMDI over a comparable period preceding the December 15-16, 2015, FOMC meeting—the start of the previous tightening cycle. The next chart shows that the CMDI was actually declining ahead of the December 2015 FOMC meeting, providing further suggestive evidence that the anticipation of tighter monetary policy does not necessarily translate into an immediate deterioration of corporate bond market functioning.
The CMDI has not had an outsized reaction to monetary policy tightening
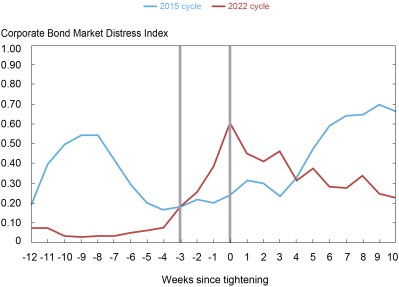
Notes: This chart illustrates the recent evolution in the Corporate Bond Market Distress Index (CMDI) to the evolution in the CMDI over a comparable period preceding the December 2015 Federal Open Market Committee meeting.
All Quiet on the Corporate Bond Market Front?
Although the CMDI has retraced somewhat from its March 19 high, it remains noticeably above its average 2021 levels. In other words, while the corporate bond market continues to function at historically average levels, market functioning has deteriorated relative to the recent past. It is thus important to continue to monitor conditions in this market as both the geopolitical situation and the monetary policy tightening cycle evolve. As shown in the staff report, the CMDI often provides a more timely signal of rapidly deteriorating conditions than any of its individual underlying metrics or, indeed, other commonly used metrics of financial distress, such as the VIX.

Nina Boyarchenko is the head of Macrofinance Studies in the Federal Reserve Bank of New York’s Research and Statistics Group.

Richard K. Crump is a financial research advisor in the Bank’s Research and Statistics Group.

Anna Kovner is the director of Financial Stability Policy Research in the Bank’s Research and Statistics Group.

Or Shachar is a financial economist in the Bank’s Research and Statistics Group.
How to cite this post:
Nina Boyarchenko, Richard Crump, Anna Kovner, and Or Shachar, “How Is the Corporate Bond Market Responding to Financial Market Volatility?,” Federal Reserve Bank of New York Liberty Street Economics, June 1, 2022, https://libertystreeteconomics.newyorkfed.org/2022/06/how-is-the-corporate-bond-market-responding-to-financial-market-volatility/.
Disclaimer
The views expressed in this post are those of the author(s) and do not necessarily reflect the position of the Federal Reserve Bank of New York or the Federal Reserve System. Any errors or omissions are the responsibility of the author(s).
 RSS Feed
 Follow Liberty Street Economics
Thanks for your interest. We plan to begin publishing monthly updates of the Corporate Bond Market Distress Index on June 29. A downloadable data file will include index values for the market CMDI as well as rating-level readings for the investment-grade and high-yield segments of the credit spectrum.
Look for it in the Economic Research section of the New York Fed’s public website.
Is possible to download the historical index data, and the sub-indices via the Fed’s website? I really enjoyed this post. Thank you for your help.