Meta Brown, Andrew F. Haughwout, Donghoon Lee,
and Wilbert van der Klaauw
Since its peak in summer 2008, U.S. consumers’ indebtedness has fallen by more than a trillion dollars. Over roughly the same period, charge-offs—the removal of obligations from consumers’ credit reports because of defaults—have risen sharply, especially on loans secured by houses, which make up about 80 percent of consumer liabilities. An important question for gauging the behavior of U.S. consumers is how to interpret these two trends. Is the reduction in debts entirely attributable to defaults, or are consumers actively reducing their debts? In this post, we demonstrate that a significant part of the debt reduction was produced by consumers borrowing less and paying off debt more quickly—a process often called deleveraging.
The source of this evidence is a special new credit data set [see a recent Federal Reserve Bank of New York (FRBNY) staff report for a description of the FRBNY Consumer Credit Panel] that allows us to look carefully on a timely basis at what consumers are doing with both their mortgage and non-mortgage debt.
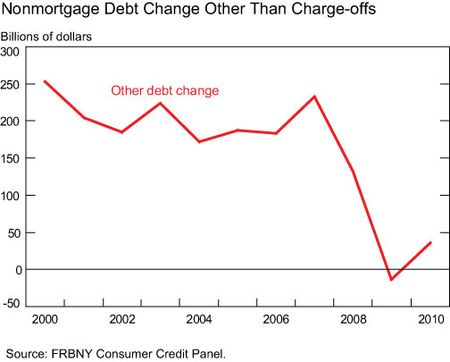
First, we can easily see that in 2009 families actively shrank their non-mortgage debt, such as credit cards, student loans, and auto loans. The chart below shows the annual change in non-mortgage debt after stripping out charge-offs. Before 2009, consumers increased their non-mortgage debt obligations each year. But in 2009 they stopped adding to their debt. Their net borrowing (other than mortgages) turned negative (by $13 billion) for the first time since at least 2000. Since consumers had been increasing their non-mortgage borrowing by an average of over $200 billion per year between 2000 and 2007, the recent data strongly point to a change in behavior during 2009. In 2010, households resumed non-mortgage borrowing, raising it $35 billion. But the scale of this net borrowing remains far below the levels of 2000-07.
Second, turning to mortgages and Home Equity Lines of Credit (HELOCs), we can see a similar pattern of more paydowns, although the analysis is more complicated. The complexity arises because it is hard to strip out the impact of mortgage charge-offs.
Unlike what happens with other forms of debt, after a mortgage charge-off and foreclosure, there is typically a house that can be resold, albeit often at a discounted price. So we can’t simply add up what is charged off by some customers without taking into account what happens to the house afterward. Take the example of a borrower who defaults on her $100,000 mortgage, and the lender repossesses her house. The lender then resells the house to a new buyer, who pays $80,000 for the property, making a 20 percent down payment and financing the remaining $64,000 with a thirty-year mortgage. So, although the borrower defaulted on a $100,000 loan, the net change of total mortgage indebtedness from this series of events is only -$36,000 (=$64,000–$100,000).
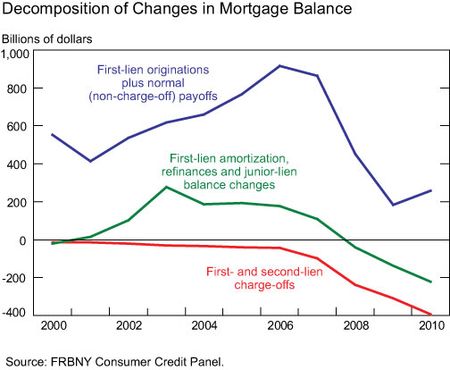
Thus, in order to focus on the active borrowing and repayment behavior of mortgage borrowers, we break down the change in balances into three categories. The first two reflect the buying and selling of houses and foreclosures, while the last one measures the behavior of consumers outside of these transactions.
-
- Changes in mortgage debt related to housing transactions, shown in blue in the chart below, include the payoffs of mortgages associated with the “normal” (i.e., outside of foreclosure) sale of a house from one owner to another, and the opening of new first mortgages for the purpose of buying a home, whether it is for sale by its previous owner or a lender. As expected, this series fell sharply between 2007 and 2009 as the value of housing transactions declined. In this calculation, we exclude the reduction in debt attributable to charge-offs.
-
- For convenience, we show the gross value of charge-offs as the red line. Here we see clear evidence of the foreclosure crisis, as charge-offs on mortgage debt exceeded $1 trillion between 2007 and 2010. Note that the 2010 figure is preliminary.
- Our main series, in green, shows the combined impact on debt of cash-out refinances of first liens, changes in junior-lien balances, including HELOCs, and regular amortization of first-lien balances. While first-lien amortization reduces balances at a fairly steady pace, the other components have declined sharply since 2007. We interpret this component of balance changes as indicative of consumer responses to economic and financial conditions. While consumers were on average extracting equity and increasing their mortgage debt until 2007, they have started to pay down debt since then. Between 2000 and 2007, consumers increased their indebtedness by an average of $130 billion per year. In 2008, this series turned negative. Consumers paid down $140 billion in mortgage debt in 2009 and $220 billion in 2010.
Taken together, the new mortgage and non-mortgage credit data we have at the New York Fed indicate that consumers have changed their behavior in ways not limited to missing payments and defaulting more often. Between 2000 and 2007, consumers’ borrowing added an annual average of about $330 billion to the cash they could spend; by 2009, consumers were diverting $150 billion away from potential spending in order to reduce the debts they had built up. This represents a remarkable $480 billion reversal in cash flow in just two years.
We care about this change in behavior because it affects American families’ balance sheets and because it affects macroeconomic patterns like those that we track as part of our policy responsibilities here at the New York Fed. The switch toward paying down debt is probably reflected in restrained growth in aggregate consumption in the United States. But the link between debt paydown and spending is complicated, depending among other factors on exactly who is paying down and who is increasing debt, a point emphasized by a recent working paper from Gauti Eggertsson and Paul Krugman.
So, U.S. consumers have been deleveraging. Holding aside defaults, they have indeed been reducing their debts at a pace not seen over the last ten years. A remaining issue is whether this deleveraging is a result of borrowers being forced to pay down debt as credit standards tightened, or a more voluntary change in saving behavior. There is evidence on both sides of this question. For example, the Fed’s Senior Loan Officer Opinion Survey indicates that credit standards were tight through much of 2007-10. On the other hand, the reduction in housing and stock values over the same period may have led families to want to reduce their debts, in an effort to restore their net worth. We hope to discuss these questions in more detail in later posts. Meanwhile, we will continue to post updates of household credit conditions on our website.
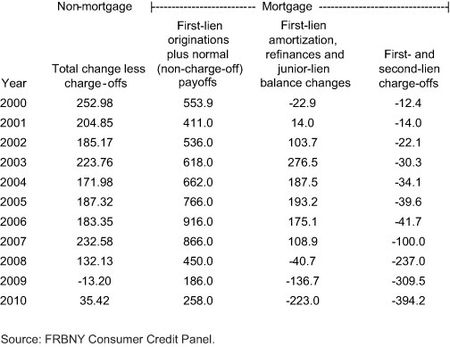
Data for the above calculations are here:
Disclaimer
The views expressed in this post are those of the author(s) and do not necessarily reflect the position of the Federal Reserve Bank of New York or the Federal Reserve System. Any errors or omissions are the responsibility of the author(s).


 RSS Feed
 Follow Liberty Street Economics
Several of the insightful comments we received relate to the important question of whether consumers’ debt pay-down was voluntary, or due to tightened credit standards. Distinguishing between the two is a challenging task. Observed changes in consumer behavior reflect decisions made in response to a changing economic environment, which includes changes in the labor, housing and credit markets.
In a recent working paper (http://www.newyorkfed.org/research/staff_reports/sr482.html) and our Quarterly Reports on Household Debt and Credit (http://data.newyorkfed.org/creditconditions/), we provide insight into the nature and causes of household deleveraging. We document a sharp 2008-09 decline in credit report inquiries, an indicator of consumer credit demand, and provide survey evidence of consumer-initiated credit card account closings in 2009. We also find evidence of credit card account closings by lenders and credit limit decreases on credit card accounts and HELOCs. As credit limit decreases are rarely requested by consumers, this suggests a lender-side contribution to consumer deleveraging. Thus the observed deleveraging seems likely to have involved reductions in both the demand and supply of credit.
In response to another comment, paid-off HELOCs due to home transactions are included in the pay-down (green line) and charged-off HELOCs due to home foreclosure are included in the charge-offs (red line). With regard to another question, the relationship between household debt and short-term inflation is complex and depends on many other factors, including trends in household wealth.
The massive swing in non-mortgage debt reflects the failure of our financial system to transmit the Fed’s accommodative monetary policy to consumers. The distinction between “forced” vs. “voluntary” deleveraging may not adequately capture the full impact of this. When banks have cut credit lines or refused to extend new credit as consumers have paid down existing balances, presumably this counts as “forced”. But many borrowers who have never missed a payment are still paying 18% or 20% on their outstanding balances, creating an extraordinary incentive for “voluntary” reduction. Credit spreads have not narrowed for consumers as they have for businesses. Moreover, the banks’ cutting back of credit lines and and (prior to recent legislation) raising rates on outstanding balances to creditworthy borrowers has also increased consumers’ perception of vulnerability associated with indebtedness. Too narrow a definition of “voluntary” will miss out the degree to which deleveraging by consumers is a consequence of institutional failure.
My question is: Did families actively reduce debt or was their debt actively reduce by the tightening of lending standards, reduction of credit card trusts due to regulatory changes, etc.? Also reducing debt instead of spending when unemployment is rapidly rising (and you still have a job) is not necessarily a change in one’s view on debt, but more likely a survivalist’s attitude. I would say this is less of a behavioral change and more a result of macroeconomic conditions (and bank lending standards) forcing families to behave in certain ways.
“A remaining issue is whether this deleveraging is a result of borrowers being forced to pay down debt as credit standards tightened, or a more voluntary change in saving behavior.” This is THE key policy question surrounding the American economy. I am currently writing a research paper on the topic. I would argue that the demand side was the key factor in the early stages of the recession, as well as the lackluster recovery. 1) Growth in monetary aggregates of Base Money, Credit, and M2 historically tightly correlated have completely diverged, indicating money is stuck in the banking system with no willing borrowers. 2) This harks back to Japan’s experience when the aggregates behaved similarly, corporate credit falling despite available credit. 3) Continued low interest rates, from the 10 year Treasury to mortgage rates despite increasing federal deficit. Such deficits under normal loan demand conditions would likely crowd out investment 4) Banks should be flush with cash while the explicit government guarantee and stock market run-up indicate credit conditions are improving. 5) Continued economic weakness is highly concentrated in credit bubble regions, indicating consumers debt-overhang. Credit demand is too often an overlooked in recessions. While popular perceptions of the Great Depression focus on the banking panic, surveys in 1932 showed 85% of businesses had either no desire or difficulty in obtaining loans.
I am interested in the home equity line of credit loan balances. Borrowers pay interest only on this debt. With housing values falling 30-50%, there is likely zero collateral value supporting these loans and substantial losses seem likely as the primary mortgage is foreclosed, or the property is sold in an orderly market transaction. Borrowers may want to de-leverage these home equity balances, but there is little incentive for an underwater borrower to repay the balance. Are banks being forced to mark these loans to market and how do these transactions affect the deleveraging you discuss?
It is wonderful to see the central bank join the blogosphere of which I am former member. I am also an alum of the Open market Desk circa 1980 and I would be shocked if there any answers to the original commenters questions. But great site and interesting stuff. All the best with it. John J Jansen
I would agree that some deleveraging is occuring by consumers as less debt is now a goal of many. Do you see this trend as deflationary? With respect to asset purchases by the Fed…do you see this policy as necessary going forward? It would seem that the Fed balance sheet is creating lots of issues with confidence in the overall market. I especially notice this emotional change when I attend economic conferences and watch programs like Kudlow on CNBC. What is your view on this?