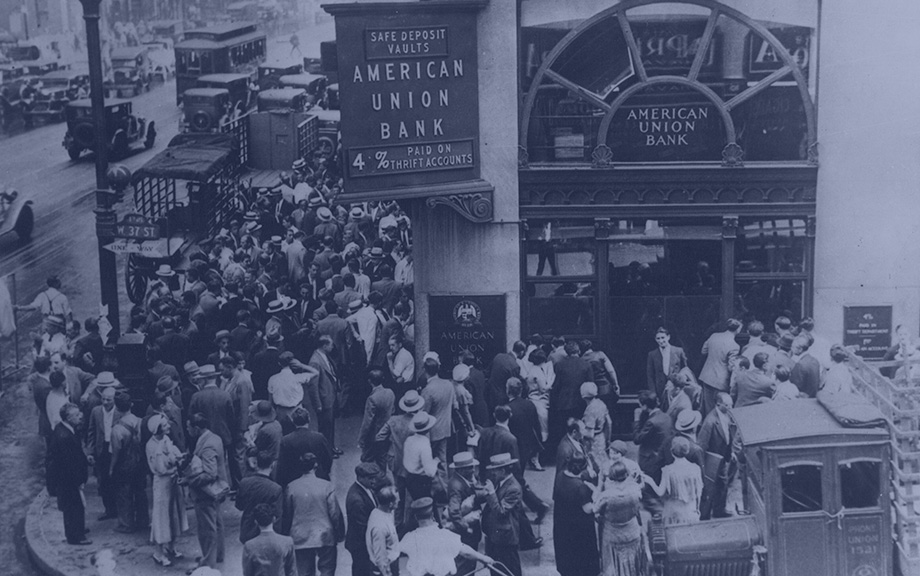
Liberty Street Economics

March 30, 2023

What Has Driven the Labor Force Participation Gap since February 2020?

Decorative image: Man walking through a busy open plan office

The U.S. labor force participation rate (LFPR) currently stands at 62.5 percent, 0.8 percentage point below its level in February 2020. This “participation gap” translates into 2.1 million workers out of the labor force. In this post, we evaluate three potential drivers of the gap: First, population aging from the baby boomers reaching retirement age puts downward pressure on participation. Second, the share of individuals of retirement age that are actually retired has risen since the onset of the COVID-19 pandemic. Finally, long COVID and disability more generally may induce more people to leave the labor force. We find that nearly all of the participation gap can be explained by population aging, which caused a significant rise in the number of retirements. Higher retirement rates compared to pre-COVID have had only a modest effect, while disability has virtually no effect.

March 24, 2023

The New York Fed DSGE Model Forecast—March 2023

decorative photo: chart and stock prices background.

This post presents an update of the economic forecasts generated by the Federal Reserve Bank of New York’s dynamic stochastic general equilibrium (DSGE) model. We describe very briefly our forecast and its change since December 2022. Note that this forecast was produced on February 27, and hence should be viewed as reflecting the state of the economy before the current banking sector turmoil.

March 10, 2023

Is Your Apartment Breaking because Your Landlord Is Broke?

Decorative photo: Water dripping from ceiling into plastic bucket on floor in living room, space for text. Leaking roof

Thirty-one percent of housing units in the United States are rental units, and rental housing is unique because unlike in the case of homeownership, renters rely on the property owner for maintenance spending. From the property owner’s perspective, building maintenance is an important investment necessary to keep the asset in good condition. However, like all investments, it is only possible to maintain a building with sufficient financial resources. In a recent staff report, I examine the relationship between a building’s financing constraints and its maintenance. I find that financially constrained buildings, colloquially “broke,” tend to be less well maintained.

Posted at 7:00 am in Corporate Finance, Housing | Permalink | Comments (0)
March 9, 2023

Inflation Persistence: Dissecting the News in January PCE Data

decorative photo of a sales receipt with the word price at the top

This post presents updated estimates of inflation persistence, following the release of personal consumption expenditure (PCE) price data for January 2023. The estimates are obtained by the Multivariate Core Trend (MCT), a model we introduced on Liberty Street Economics last year and covered most recently here and here. The MCT is a dynamic factor model estimated on monthly data for the seventeen major sectors of the PCE price index. It decomposes each sector’s inflation as the sum of a common trend, a sector-specific trend, a common transitory shock, and a sector-specific transitory shock. The trend in PCE inflation is constructed as the sum of the common and the sector-specific trends weighted by the expenditure shares. 

Posted at 7:00 am in Inflation, Macroeconomics | Permalink | Comments (0)
March 6, 2023

Insights from Newly Digitized Banking Data, 1867-1904

decorative photo: 19th century bank building with roman columns and resources/liabilities data superimposed.

Call reports—regulatory filings in which commercial banks report their assets, liabilities, income, and other information—are one of the most-used data sources in banking and finance. Though call reports were collected as far back as 1867, the underlying data are only easily accessible for the recent past: the mid-1980s onward in the case of the FDIC’s FFIEC call reports. To help researchers look farther back in time, we’ve begun creating a complete digital record of this “missing” call report data; this data release covers 1867 through 1904, the bulk of the National Banking Era. Here, we describe the digitization process and highlight some of the interesting features of that era from a research perspective.

March 1, 2023

The Dollar’s Imperial Circle

Decorative: Large dollar sign with circles around it superimposed over an image of a city and world map.

The importance of the U.S. dollar in the context of the international monetary system has been examined and studied extensively. In this post, we argue that the dollar is not only the dominant global currency but also a key variable affecting global economic conditions. We describe the mechanism through which the dollar acts as a procyclical force, generating what we dub the “Dollar’s Imperial Circle,” where swings in the dollar govern global macro developments. 

February 27, 2023

Does the CRA Increase Household Access to Credit?

Illustration: bank building with arrow pointing toward row of community houses. Question below: Is household borrowing impacted?

Congress passed the Community Reinvestment Act (CRA) in 1977 to encourage banks to meet the needs of borrowers in the areas in which they operate. In particular, the Act is focused on credit access to low- and moderate-income communities that had historically been subject to discriminatory practices like redlining.

February 23, 2023

A Turning Point in Wage Growth?

The surge in wage growth experienced by the U.S. economy over the past two years is showing some tentative signs of moderation. In this post, we take a closer look at the underlying data by estimating a model designed to isolate the persistent component—or trend—of wage growth. Our central finding is that this trend may have peaked in early 2022, having experienced an earlier rise and subsequent moderation that were broad-based across sectors. We also find that wage growth seems to be moderating more slowly than the trend in services inflation.

February 22, 2023

How Much Can GSCPI Improvements Help Reduce Inflation?

Decorative image: Global map with cargo ship and bar chart

Inflationary pressures—their determinants and evolution—continue to dominate policy discussions. In this post, we provide a simple framework to analyze the determinants of different measures of inflation and use it to lay out a risk-scenario analysis. We find that global supply factors captured by the New York Fed’s Global Supply Chain Pressure Index (GSCPI) are strongly associated with inflationary developments measured by the producer price index (PPI) and by the c0nsumer price index (CPI). Under the assumption that the GSCPI falls back to its historical average over twelve months, our model would project a substantial easing of consumer price inflation over 2023 to below 4.0 percent. The normalization of the GSCPI would then be consistent with a return of inflation to levels consistent with a soft-landing scenario.

February 21, 2023

How Have Swings in Demand Affected Global Supply Chain Pressures?

decorative: Global logistics network transportation, Map global logistics partnership connection of Container Cargo freight ship for Logistics Import Export background

In a January 2022 post, we first presented the Global Supply Chain Pressure Index (GSCPI), a parsimonious global measure designed to capture supply chain disruptions using a range of indicators. The spirit of our index was to isolate supply factors, such as shutdowns in response to the pandemic, that put pressure on the global supply chain. In this post, we describe an auxiliary index, the Net GSCPI, which differs from the GSCPI by not filtering out demand factors. This “net” index is meant to capture global supply chain stress from both the supply and demand sides. Our analysis documents that the net index is currently below its historical average, unlike the original index, due to both the easing of supply constraints and a contraction in global demand.

About the Blog

Liberty Street Economics features insight and analysis from New York Fed economists working at the intersection of research and policy. Launched in 2011, the blog takes its name from the Bank’s headquarters at 33 Liberty Street in Manhattan’s Financial District.

The editors are Michael Fleming, Andrew Haughwout, Thomas Klitgaard, and Asani Sarkar, all economists in the Bank’s Research Group.

Liberty Street Economics does not publish new posts during the blackout periods surrounding Federal Open Market Committee meetings.

The views expressed are those of the authors, and do not necessarily reflect the position of the New York Fed or the Federal Reserve System.

Economic Research Tracker

Liberty Street Economics is now available on the iPhone® and iPad® and can be customized by economic research topic or economist.

Economic Inequality

image of inequality icons for the Economic Inequality: A Research Series

This ongoing Liberty Street Economics series analyzes disparities in economic and policy outcomes by race, gender, age, region, income, and other factors.

Most Viewed

Last 12 Months

Comment Guidelines

We encourage your comments and queries on our posts and will publish them (below the post) subject to the following guidelines:

Please be brief: Comments are limited to 1500 characters.

Please be quick: Comments submitted after COB on Friday will not be published until Monday morning.

Please be aware: Comments submitted shortly before or during the FOMC blackout may not be published until after the blackout.

Please be on-topic and patient: Comments are moderated and will not appear until they have been reviewed to ensure that they are substantive and clearly related to the topic of the post. We reserve the right not to post any comment, and will not post comments that are abusive, harassing, obscene, or commercial in nature. No notice will be given regarding whether a submission will or will not be posted.‎

Send Us Feedback

Disclosure Policy

The LSE editors ask authors submitting a post to the blog to confirm that they have no conflicts of interest as defined by the American Economic Association in its Disclosure Policy. If an author has sources of financial support or other interests that could be perceived as influencing the research presented in the post, we disclose that fact in a statement prepared by the author and appended to the author information at the end of the post. If the author has no such interests to disclose, no statement is provided. Note, however, that we do indicate in all cases if a data vendor or other party has a right to review a post.

Archives