


184 posts on "Banks"
July 7, 2026
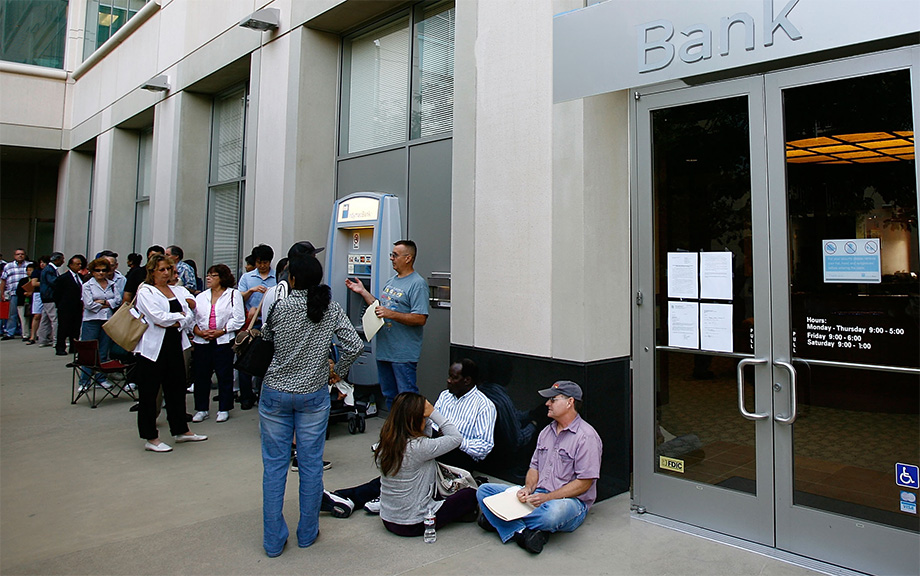
What Do Over 3,000 Bank Runs Teach Us About Banking Crises?
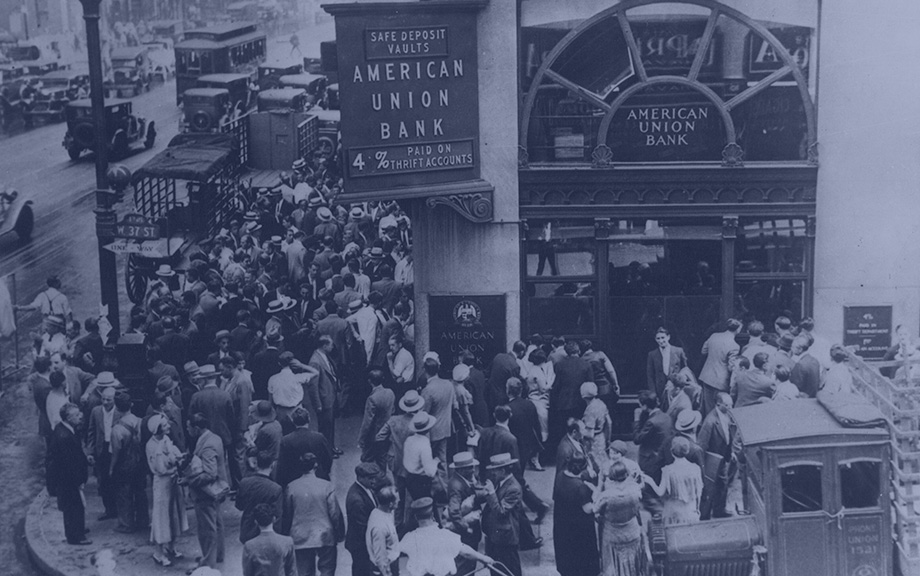
Runs on financial institutions are one of the salient markers of financial crises. But the role of runs in crises is a topic of longstanding debate. Runs can be seen as the key turning point, whereby even small shocks can generate severe crises with widespread bank failures. Another view is that runs are mainly a symptom of deeper rot in the financial system, exacerbating crises rather than being their primary cause. Understanding this debate has first order implications for how to think about financial crises and the appropriate policy responses. In this post, we use a new database of more than 3,000 bank runs (introduced in our companion post) to show that poor fundamentals are central to explaining both when runs occur and when they have severe economic effects. We argue that this evidence tempers the view that small shocks can have outsized real effects through self-fulfilling run dynamics.
Using AI to Let History Speak About Bank Runs

Banking crises are commonly associated with bank runs and banking panics, yet our empirical understanding of bank runs is constrained by a lack of bank-level data. In a new paper, we use large language models (LLMs) to extract information on bank runs from millions of digitized historical newspaper pages, creating the most comprehensive database of bank runs in U.S. history. Every bank run episode that we identify is documented on a companion website where users can browse and examine individual episodes, and read the original newspaper articles. In this post, we describe how we built this dataset and discuss what its basic features reveal.
May 8, 2026
Stress and Strain from NBFIs to Banks

Do the recent stresses in the NBFI space—notably the bankruptcies of Tricolor and First Brands, and the decision of Blue Owl Capital Corp II (OBDC II) to end its redemption program and return capital through a wind-down of the fund—create distress for banks? The general sentiment is that the recent stresses are unlikely to amount to systemic concerns, although it does not mean there might not be “some stress and strain” for banks and that policymakers are “watching carefully” for exposure across banks. In a series of previous posts, we showed that shocks to nonbank financial institutions (NBFIs) directly impact banks that have exposures to NBFIs. In this post, we show that bank stocks have been directly impacted by NBFIs yet again. In short, NBFI troubles do result in “stress and strain” for banks.
April 16, 2026
Bank Failures: The Roles of Solvency and Liquidity
Do banks fail because of runs or because they become insolvent? Answering this question is central to understanding financial crises and designing effective financial stability policies. Long-run historical evidence reveals that the root cause of bank failures is usually insolvency. The importance of bank runs is somewhat overstated. Runs matter, but in most cases they trigger or accelerate failure at already weak banks, rather than cause otherwise sound banks to fail.
April 2, 2026
Treasury Market Liquidity Since April 2025
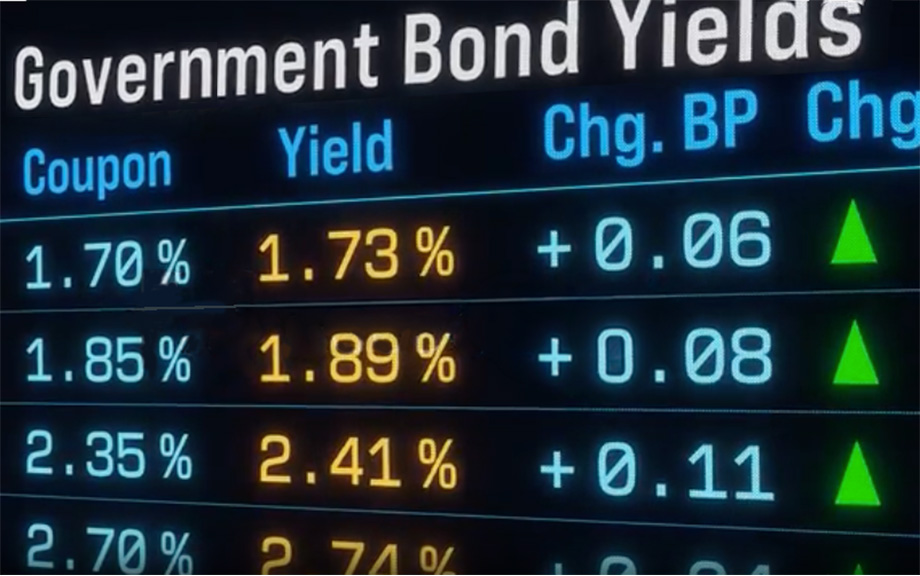
In this post, we examine the evolution of U.S. Treasury market liquidity over the past year, which has witnessed myriad economic and political developments. Liquidity worsened markedly one year ago as volatility increased following the announcement of higher-than-expected tariffs. Liquidity quickly improved when the tariff increases were partially rolled back and then remained fairly stable thereafter (through the end of our sample in February 2026), including after the recent Supreme Court decision striking down the emergency tariffs and the subsequent announcement of new tariffs.
March 31, 2026
Behind the ATM: Exploring the Structure of Bank Holding Companies

Many modern banking organizations are highly complex. A “bank” is often a larger structure made up of distinct entities, each subject to different regulatory, supervisory, and reporting requirements. For researchers and policymakers, understanding how these institutions are structured and how they have evolved over time is essential. In this post, we illustrate what a modern financial holding company looks like in practice, document how banks’ organizational structures have changed over time, and explain why these details matter for conducting accurate analyses of the financial system.
December 22, 2025
A New Public Data Source: Call Reports from 1959 to 2025

Call Reports are regulatory filings in which commercial banks report their assets, liabilities, income, and other information. They are one of the most-used data sources in banking and finance. In this post, we describe a new dataset made available on the Federal Reserve Bank of New York’s website that contains time-consistent balance sheets and income statements for commercial banks in the United States from 1959 to 2025.
December 17, 2025
Letters of Recommendation in the PhD Job Market: Lessons from Specialized Banks

Banks must extract useful signals of a potential borrower’s quality from a large set of possibly informative characteristics when making lending decisions. A model that speaks to how banks specialize in lending to an industry in order to better extract signals from data can potentially be applied to a number of real-world scenarios. In this post, we apply lessons from such a model to a topic of timely relevance in economics: job market recommendation letters. Institutions looking to hire new economists must evaluate PhD applicants based on limited and often noisy signals of future performance, including letters of recommendation from these applicants’ advisors or co-authors. Using insights from our model, we argue that the value of these letters depends on who reads them.
December 15, 2025
Designing Bank Regulation with Accounting Discretion

Why does the banking industry remain prone to large and costly disruptions despite being so heavily regulated? Is there a need for more regulation, less regulation, or simply different regulation? Our recent Staff Report combines insights from academic research in economics, finance, and accounting to provide a deeper understanding of the challenges involved in designing and implementing bank regulation, as well as opportunities for future exploration. This post focuses on the regulation of bank capital, but the ideas are applicable more broadly.
November 18, 2025
U.S. Banks Have Developed a Significant Nonbank Footprint

In light of the rapid growth of nonbank financial institutions (NBFIs), many have argued that bank-led financial intermediation is on the decline, based on the traditional notion that banks operate to take in deposits and make loans. However, we argue that deposit-taking and loan-making have not accurately characterized U.S. banking operations in recent decades. Instead, as we propose in this post, absent regulatory restrictions, banks naturally expand their boundaries to include NBFI subsidiaries. A significant component of the growth of NBFIs has in fact taken place inside the boundaries of banking firms.
 RSS Feed
 Follow Liberty Street Economics