


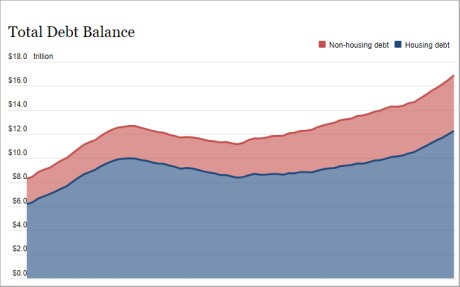
This morning, the New York Fed’s Center for Microeconomic Data released the 2023:Q3 Quarterly Report on Household Debt and Credit. After only moderate growth in the second quarter, total household debt balances grew $228 billion in the third quarter across all types, especially credit cards and student loans. Credit card balances grew $48 billion this quarter and marked the eighth quarter of consecutive year-over year increases. The $154 billion nominal year-over-year increase in credit card balances marks the largest such increase since the beginning of our time series in 1999. The increase in balances is consistent with strong nominal spending and real GDP growth over the same time frame. But credit card delinquencies continue to rise from their historical lows seen during the pandemic and have now surpassed pre-pandemic levels. In this post, we focus on which groups have fallen behind on debt payments and discuss whether rising delinquencies are narrowly concentrated or broad based.
The Quarterly Report on Household Debt and Credit (page 13) shows the percentage of balances transitioning to delinquency by loan type, which are reported as four-quarter moving sums to avoid seasonal trends. These series reached historic lows for all loan types during 2021 due to large fiscal transfers, reduced consumption opportunities, and broad-based forbearance. Apart from student loans, which were aided by administrative forbearance that only recently ended, new delinquencies for all loan types have risen since. Rising delinquencies were inevitable from historic lows, but it has been less clear how high and until when they might rise.
In our last blog post, we hinted that there were some signs of stabilization for auto loan and credit card delinquencies. And while auto loan delinquency does seem to be stabilizing for all except the young, moderating new credit card delinquencies in the first and second quarter were followed by higher delinquency transitions in the third quarter. The chart below (and all subsequent charts) shows the person-level rate of transitions from current status last quarter to delinquency in this quarter. Notably, this differs from the credit card series in page 13 of the Quarterly Report since these are not balance-weighted and do not account for seasonal trends. Historically, new credit card delinquency transitions peak in the fourth quarter and decline in first and second quarter before larger increases over the third and fourth quarters. The series shows that 2 percent of credit card users moved from current status in the second quarter of 2023 to thirty or more days past due on at least one account in the third quarter. This is up from roughly 1.7 percent in the first and second quarters of 2023, and higher than the third quarter average between 2015-19 of 1.7 percent.
The Share of Newly Delinquent Credit Card Users Rose in the Third Quarter and Exceeds the Pre-Pandemic Average
Share of credit card borrowers who are newly delinquent (in percent)
Who Is Driving the Rising Credit Card Delinquencies?
In the next series of charts, we explore the variation in this delinquency transition rate for several different groups of credit card users. First, we look at delinquencies by birth generation. While Baby Boomers (born 1946-64), Generation X (born 1965-79), and Generation Z (born 1995-2011) credit card users have delinquency rates similar to their pre-pandemic levels and trends, Millennial (born 1980-94) credit card users began exceeding pre-pandemic delinquency levels in the middle of last year and now have transition rates 0.4 percentage point higher than in the third quarter of 2019.
Millennial Credit Card Delinquency Exceeds Pre-Pandemic Levels while Baby Boomers, Generation X, and Generation Z Are at or near Their 2019 Averages
Share of credit card borrowers who are newly delinquent (in percent)
Notes: Credit card users are categorized into generations using their birth year. Baby Boomers are those born between 1946 and 1964, Generation X are 1965 to 1979, Millennials are 1980 to 1994, and Generation Z are 1995 to 2011.
The chart below shows how credit card delinquencies have evolved by zip median income. We categorize all zip codes into four groups ranked by area income with the first quartile representing the lowest and the fourth quartile representing the highest income. The lowest-income areas persistently have the highest delinquency rates, but all four quartiles are now above their pre-pandemic levels. Although not shown here, the pattern for delinquency rates by U.S. Census region is similar to the zip income pattern. The South has higher delinquency rates over the time series, but all regions have new credit card delinquency rates higher than their pre-pandemic averages and are evolving similarly.
Delinquency Rates Are Rising Fastest for Lower-Income Areas, but Each Income Quartile Area Has Rates at or above Their 2019 Levels
Share of credit card borrowers who are newly delinquent (in percent)
Notes: Credit card users are categorized into zip income quartiles by ranking zip code median income from lowest to highest and splitting zip codes into four equally sized groups by population.
Next, we look at how balances have evolved based on borrower credit profiles. The chart below shows the delinquency transition rates for card users by their outstanding total credit card balances in the previous quarter. Generally, those with higher total balances are more likely to transition to delinquency, and recent trends are consistent with this pattern. Those with combined balances over $20,000 have the highest transition rate since the beginning of 2022 both in the level and the pace of increase, but the prevalence of balances this large is low at 6 percent of credit card holders. Meanwhile, borrowers with balances of less than $5,000, 68 percent of credit card borrowers last quarter, have recent delinquency transition rates similar to their pre-pandemic levels.
Those with the Largest Credit Card Balances Were the Most Likely to Fall behind but Make Up a Small Share of Credit Card Users
Share of credit card borrowers who are newly delinquent (in percent)
Notes: Credit card users are categorized into balance groups using their total credit card balance in the previous quarter. Those who had a zero balance in both the current quarter and previous quarter are excluded (as they cannot transition to delinquency). Borrowers with balances over $1 million are excluded.
The last of these charts shows the delinquency transition rates for credit card users based on whether a borrower also has other types of debt. The share of mortgage holders with a new credit card delinquency is only slightly higher than before the pandemic. Meanwhile, borrowers with auto loans (gold line) or student loans (red line) were more likely to fall behind on their loans than before the pandemic. This was especially the case for those with student loans and auto loans (shown in light blue). This group’s transition rate into a credit card delinquency is 0.6 percentage point higher than it was prior to the pandemic. These repayment difficulties will likely continue to mount for student loan borrowers, as shown in our recent special survey of such borrowers, now that student loan payments have resumed.
Credit Card Delinquencies Are Rising Particularly Quickly for Those with Auto and Student Loans
Share of credit card borrowers who are newly delinquent (in percent)
Notes: Credit card users are categorized into groups based on whether they had a nonzero balance for other debt types. Borrowers can contribute to multiple groups depending on which loans they hold.
Conclusion
Delinquency rates on most credit product types have been rising from historic lows since the middle of 2021. The transition rate into delinquency remains below the pre-pandemic level for mortgages, which comprise the largest share of household debt, but auto loan and credit card delinquencies have surpassed pre-pandemic levels and continue to rise. While the growth in auto loan delinquency has appeared to moderate over recent quarters, credit card delinquency rates have risen at a sharper pace. Even though the increase in delinquency appears to be broad based across income groups and regions, it is disproportionately driven by Millennials, those with auto or student loans, and those with relatively higher credit card balances. The labor market and the general economy have remained resilient throughout this period which makes pinning down the causes of rising delinquencies rates more difficult. Whether this is a consequence of shifts in lending, overextension, or deeper economic distress associated with higher borrowing costs and price pressures is an important topic for further research. We will continue to monitor conditions for household balance sheets for further signs of distress.

Andrew F. Haughwout is director of Household and Public Policy Research in the Federal Reserve Bank of New York’s Research and Statistics Group.

Donghoon Lee is an economic research advisor in Consumer Behavior Studies in the Federal Reserve Bank of New York’s Research and Statistics Group.

Daniel Mangrum is a research economist in Household and Public Policy Research in the Federal Reserve Bank of New York’s Research and Statistics Group.

Belicia Rodriguez is a senior research analyst in the Federal Reserve Bank of New York’s Communications and Outreach Group.

Wilbert van der Klaauw is an economic research advisor on Household and Public Policy Research in the Federal Reserve Bank of New York’s Research and Statistics Group.

Joelle Scally is a regional economic advisor in the Federal Reserve Bank of New York’s Research and Statistics Group.

Crystal Wang is a research analyst in the Federal Reserve Bank of New York’s Research and Statistics Group.
How to cite this post:
Andrew Haughwout, Donghoon Lee, Daniel Mangrum, Belicia Rodriguez, Joelle Scally, Wilbert van der Klaauw, and Crystal Wang, “Credit Card Delinquencies Continue to Rise—Who Is Missing Payments?,” Federal Reserve Bank of New York Liberty Street Economics, November 7, 2023, https://libertystreeteconomics.newyorkfed.org/2023/11/credit-card-delinquencies-continue-to-rise-who-is-missing-payments/
BibTeX: View |


Disclaimer
The views expressed in this post are those of the author(s) and do not necessarily reflect the position of the Federal Reserve Bank of New York or the Federal Reserve System. Any errors or omissions are the responsibility of the author(s).
 RSS Feed
 Follow Liberty Street Economics