


The strength of consumer spending so far this year has surprised most private forecasters. In this post, we examine the factors behind this strength and the implications for consumption in the coming quarters. First, we revisit the measurement of “excess savings” that households have accumulated since 2020, finding that the estimates of remaining excess savings are very sensitive to assumptions about measurement, estimation period, and trend type, which renders them less useful. We thus broaden the discussion to other aspects of the household balance sheet. Using data from the New York Fed’s Consumer Credit Panel, we calculate the additional cash flows made available for consumption as a result of households’ adjustments to their debt holdings. To detect signs of stress in household financial positions, we examine recent trends in delinquencies and find the evidence to be mixed, suggesting that certain stresses have emerged for some households. In contrast, we find that the New York Fed’s Survey of Consumer Expectations still points to a solid outlook for consumer spending.
Surprising Consumption Strength
Real personal consumption expenditures (PCE) have been remarkably sturdy since the onset of the pandemic, to the surprise of many analysts over much of this period. The surprises have been especially notable over the first half of this year, as real PCE growth has held up in the face of ongoing monetary policy tightening and this spring’s banking system stress.
To quantify the extent of these surprises, we chart errors in the six-month-ahead Blue Chip Consensus forecasts of quarterly real PCE growth (measured at an annual rate). A positive forecast error (shown in the blue bars) at time t means that the realized growth rate (shown in red) was above the forecasts from six months earlier.
Consumption Has Surprised to the Upside, Especially in 2023
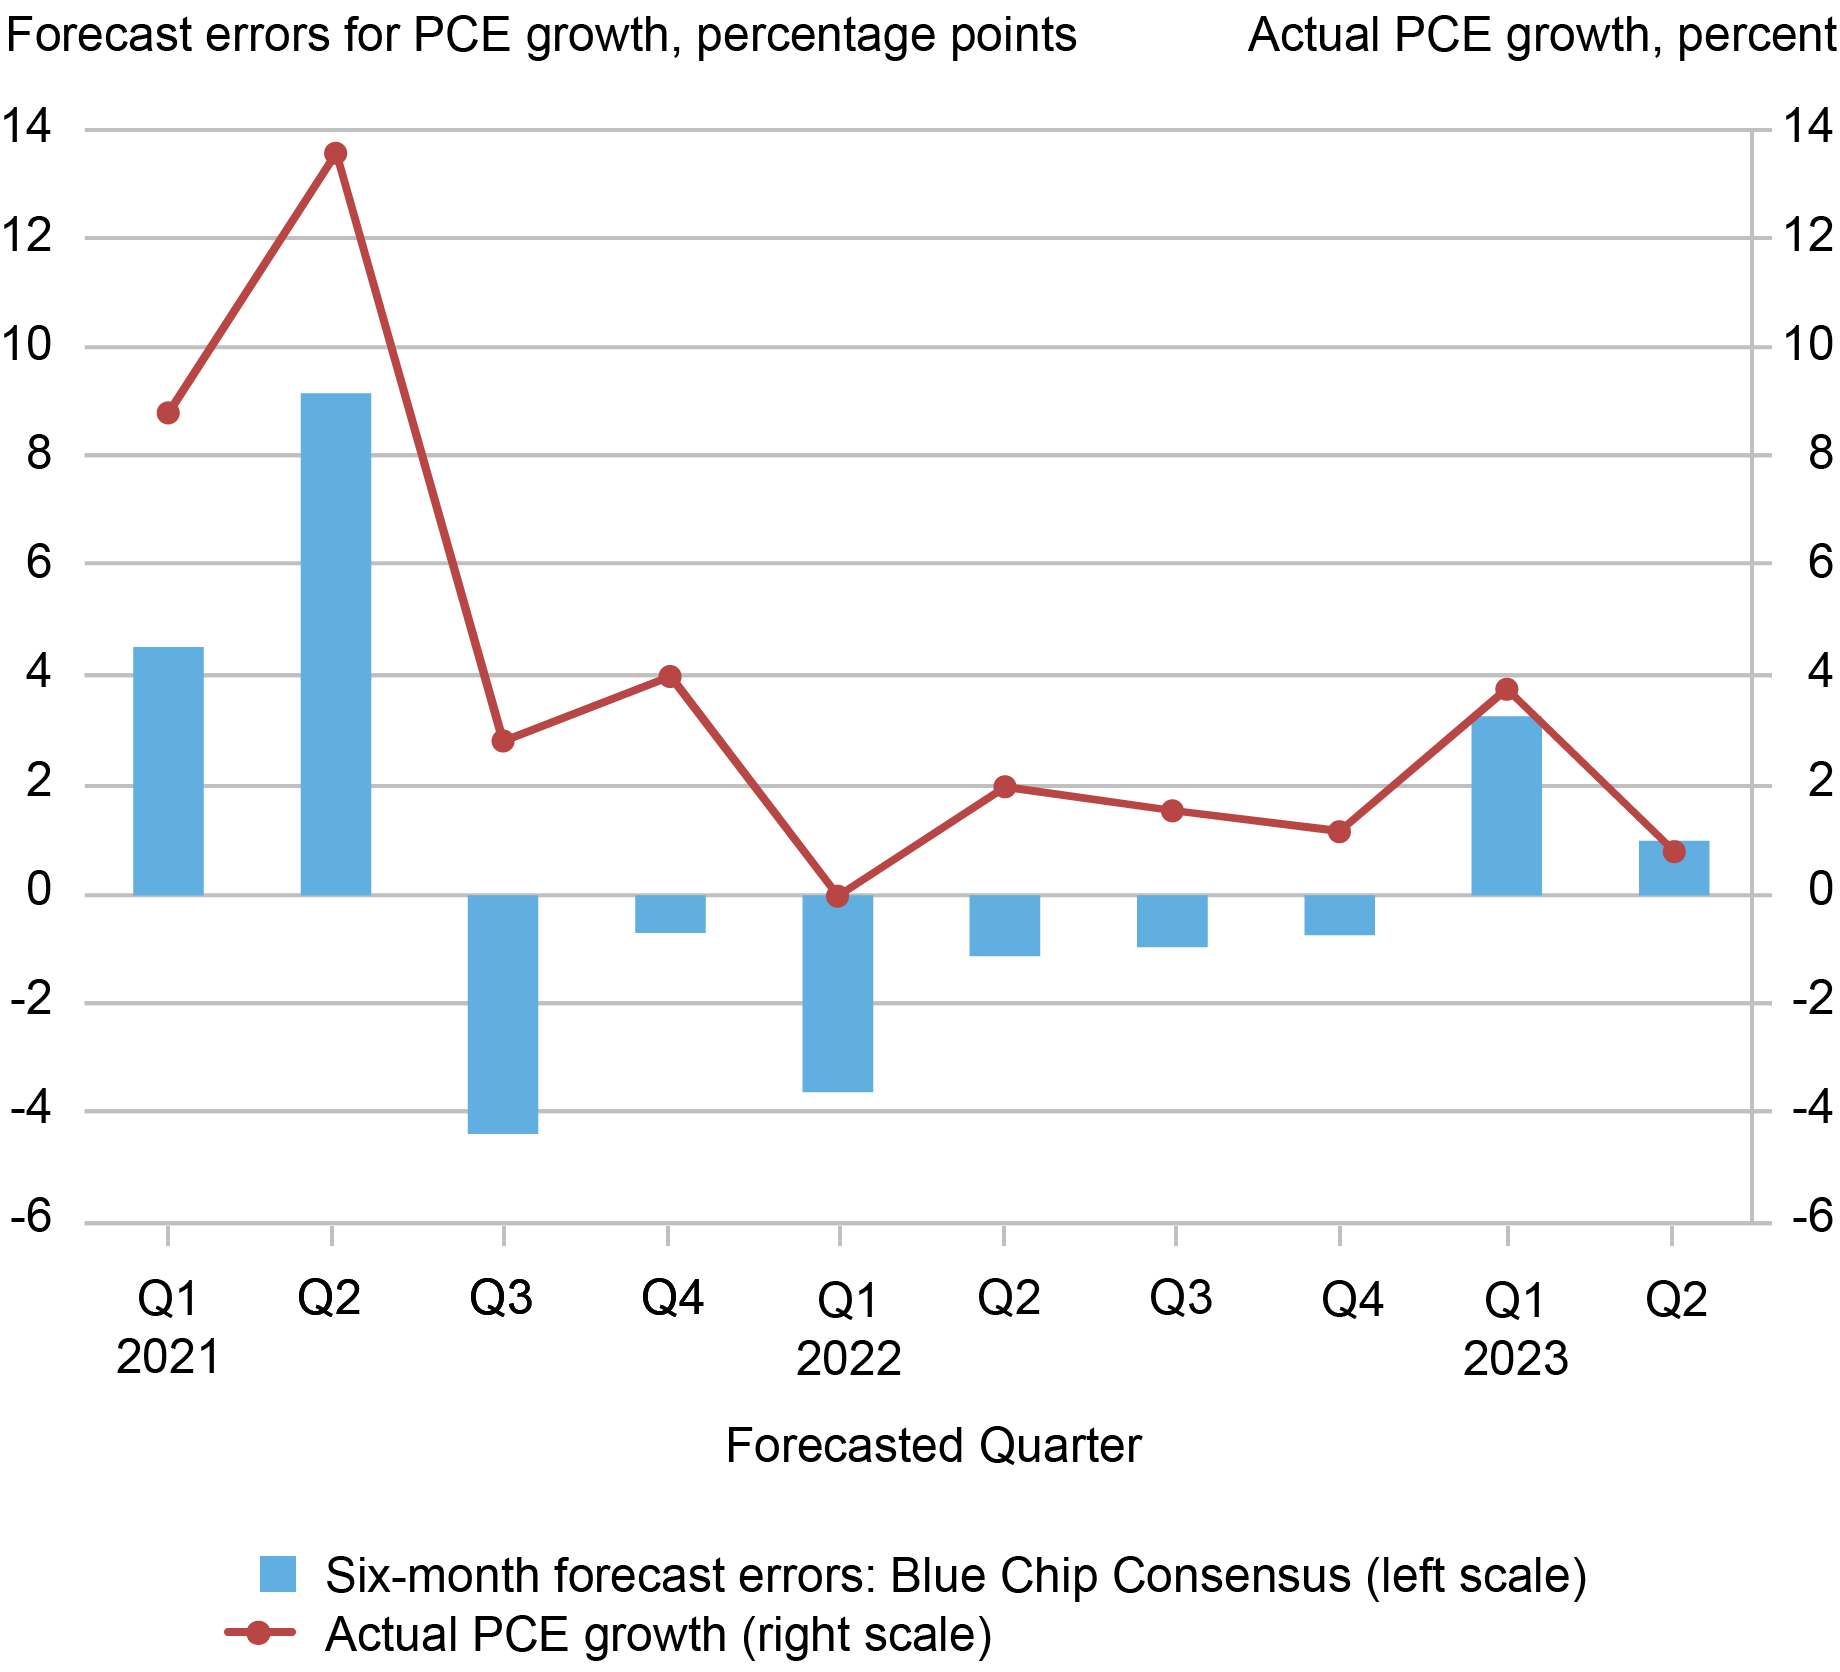
Sources: Bureau of Economic Analysis; Blue Chip Economic Indicators.
Notes: The red line shows the real (inflation-adjusted) quarterly annualized rate of growth for personal consumption expenditures (PCE). The blue bars show the difference between realized PCE growth and the six-month-ahead Blue Chip Consensus forecasts, with positive values indicating that consumption growth was higher than expected.
In the first half of 2021, real PCE grew much faster than predicted, likely due to an unexpectedly fast rollout of vaccines and a larger-than-expected fiscal stimulus–in terms of both magnitude and multiplier effect on consumption. Throughout 2022, however, consumption was weaker than forecasted, probably due to a combination of higher-than-expected inflation, a larger effect on disposable income from the unwinding of pandemic-related fiscal support, and a faster-than-expected tightening of financial conditions.
But in 2023, we’ve seen upside surprises once again, particularly for the first quarter. Moreover, the most recent Blue Chip Consensus forecast for consumption growth in 2023:Q3 is higher than what was expected six months ago. This shift has occurred because many forecasters in the past few months have abandoned their projections of recession and negative consumption growth. We now attempt to understand these forecast errors.
Excess Savings
We begin our discussion with excess savings, which has received a lot of attention from economists and the business press. The idea is that large fiscal transfers and reduced consumption opportunities during the pandemic led households to save more than they otherwise would have done and now those savings may be available to support consumption. There is tremendous uncertainty, however, about how much excess savings still remain in the household sector.
While analysts generally agree that excess savings reached high levels over the course of 2021, significant differences about their recent level have developed; for example, see Aladangady et al., de Soyres et al., and Abdelrahman and Oliveira (Higgins and Klitgaard study excess savings in the international context). The differences in estimates for the United States are attributable to technical factors like the assumed pre-pandemic trend, and different views about whether the savings rate or gross household saving (in dollars) is the appropriate way to think about any excess.
As we move further beyond the pandemic, measuring excess savings becomes increasingly fraught, since it relies heavily on assumptions about behavior in the absence of the pandemic. Consequently, in thinking about the recent resilience of consumption and the implications for the future, a broader assessment of households’ financial positions now seems a more important consideration than excess savings in isolation. In the remainder of the post, we focus on an important element of such an assessment: the role of debt in supporting households’ capacity to sustain consumption.
Household Debt
In addition to savings, households have relatively illiquid assets (like housing) and liabilities (like mortgages and credit card debts) on their balance sheets. The pandemic period featured forbearances on several types of debt, along with large fiscal transfers and very low interest rates, leading to significant improvements in household cash flows. For example, about 14 million households refinanced their mortgages, reducing their mortgage bill by $30 billion per year through 2021. The red line in the next chart shows that the cumulative savings from these lower payments stood at about $120 billion as of 2023:Q2, with recent quarters bringing declines as newer mortgages carry higher balances and higher interest rates.
In addition to these savings, homeowners withdrew unusually large amounts of home equity, primarily in the form of cash-out refinances during the period of low rates. These funds, shown in the blue line below, are also available for consumption and amount to $280 billion in 2023:Q2.
Equity Extraction and Mortgage Refinances Contributed to Liquid Funds Available for Consumption
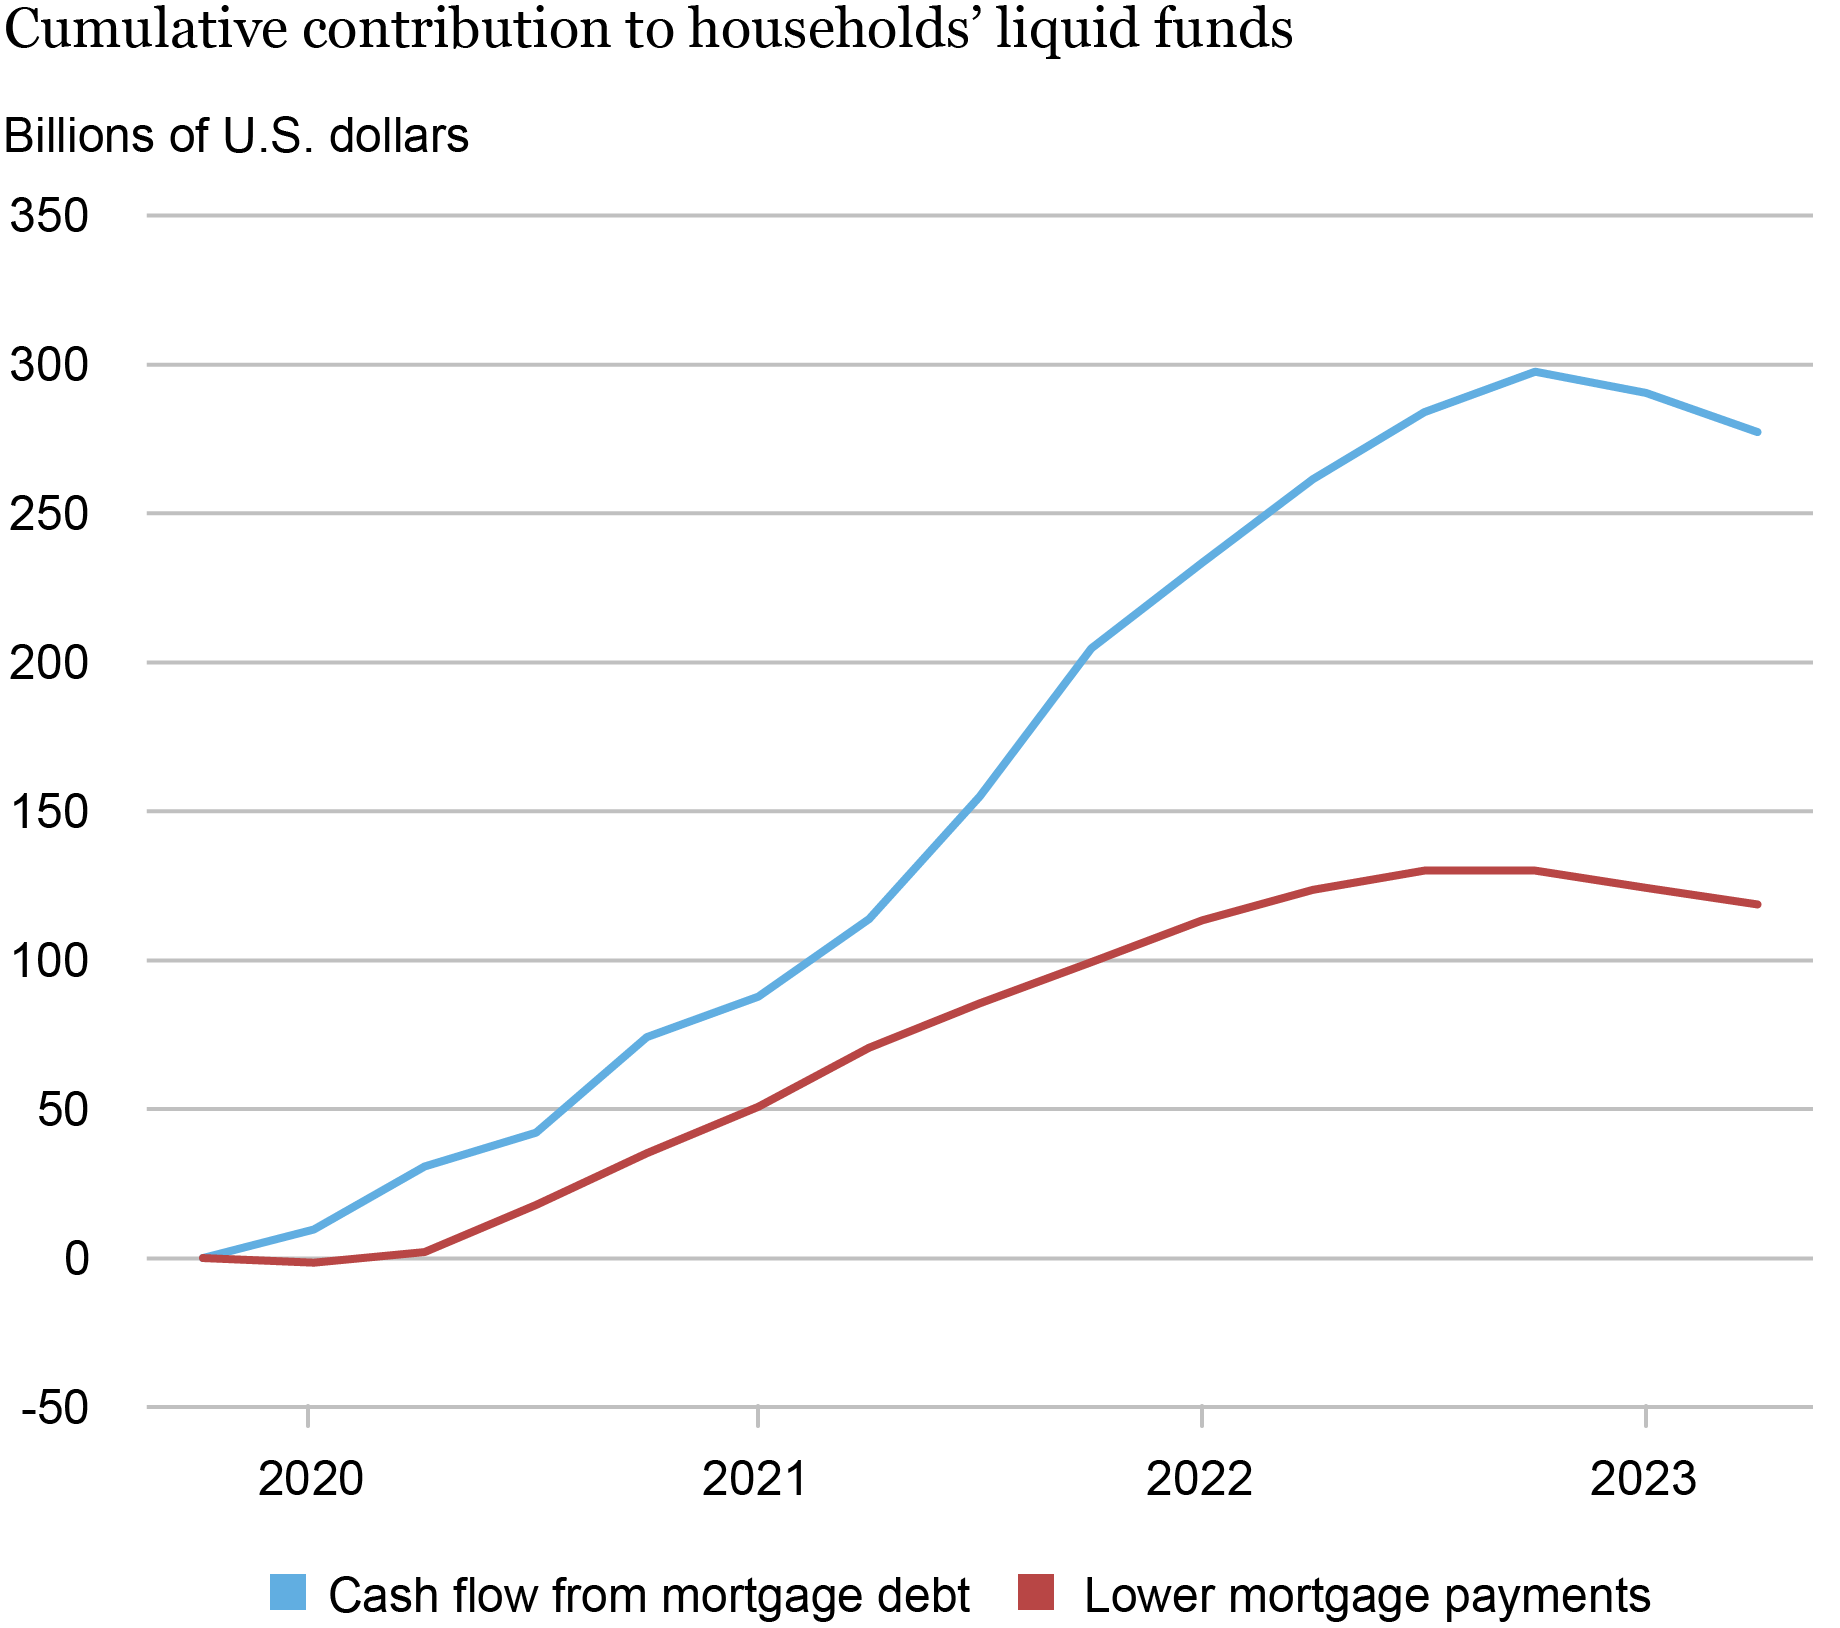
Source: New York Fed Consumer Credit Panel / Equifax
Other forms of household debt also supported consumption. Payments on student debt, which competes with auto loans to be the second largest household sector liability, have largely been in forbearance since the early stages of the pandemic. Payments on federal student loans prior to the payment moratorium totaled about $70 billion per year, meaning that through 2023:Q2 about $260 billion was left in the household sector; see the blue line in our next chart. By comparison, auto loans (red line) have made relatively small contributions to the funds available for consumption, while some of the funds that households saved have been reflected in reduced credit card balances (gold line).
Credit Card Paydowns Offset Student Loan Forbearance
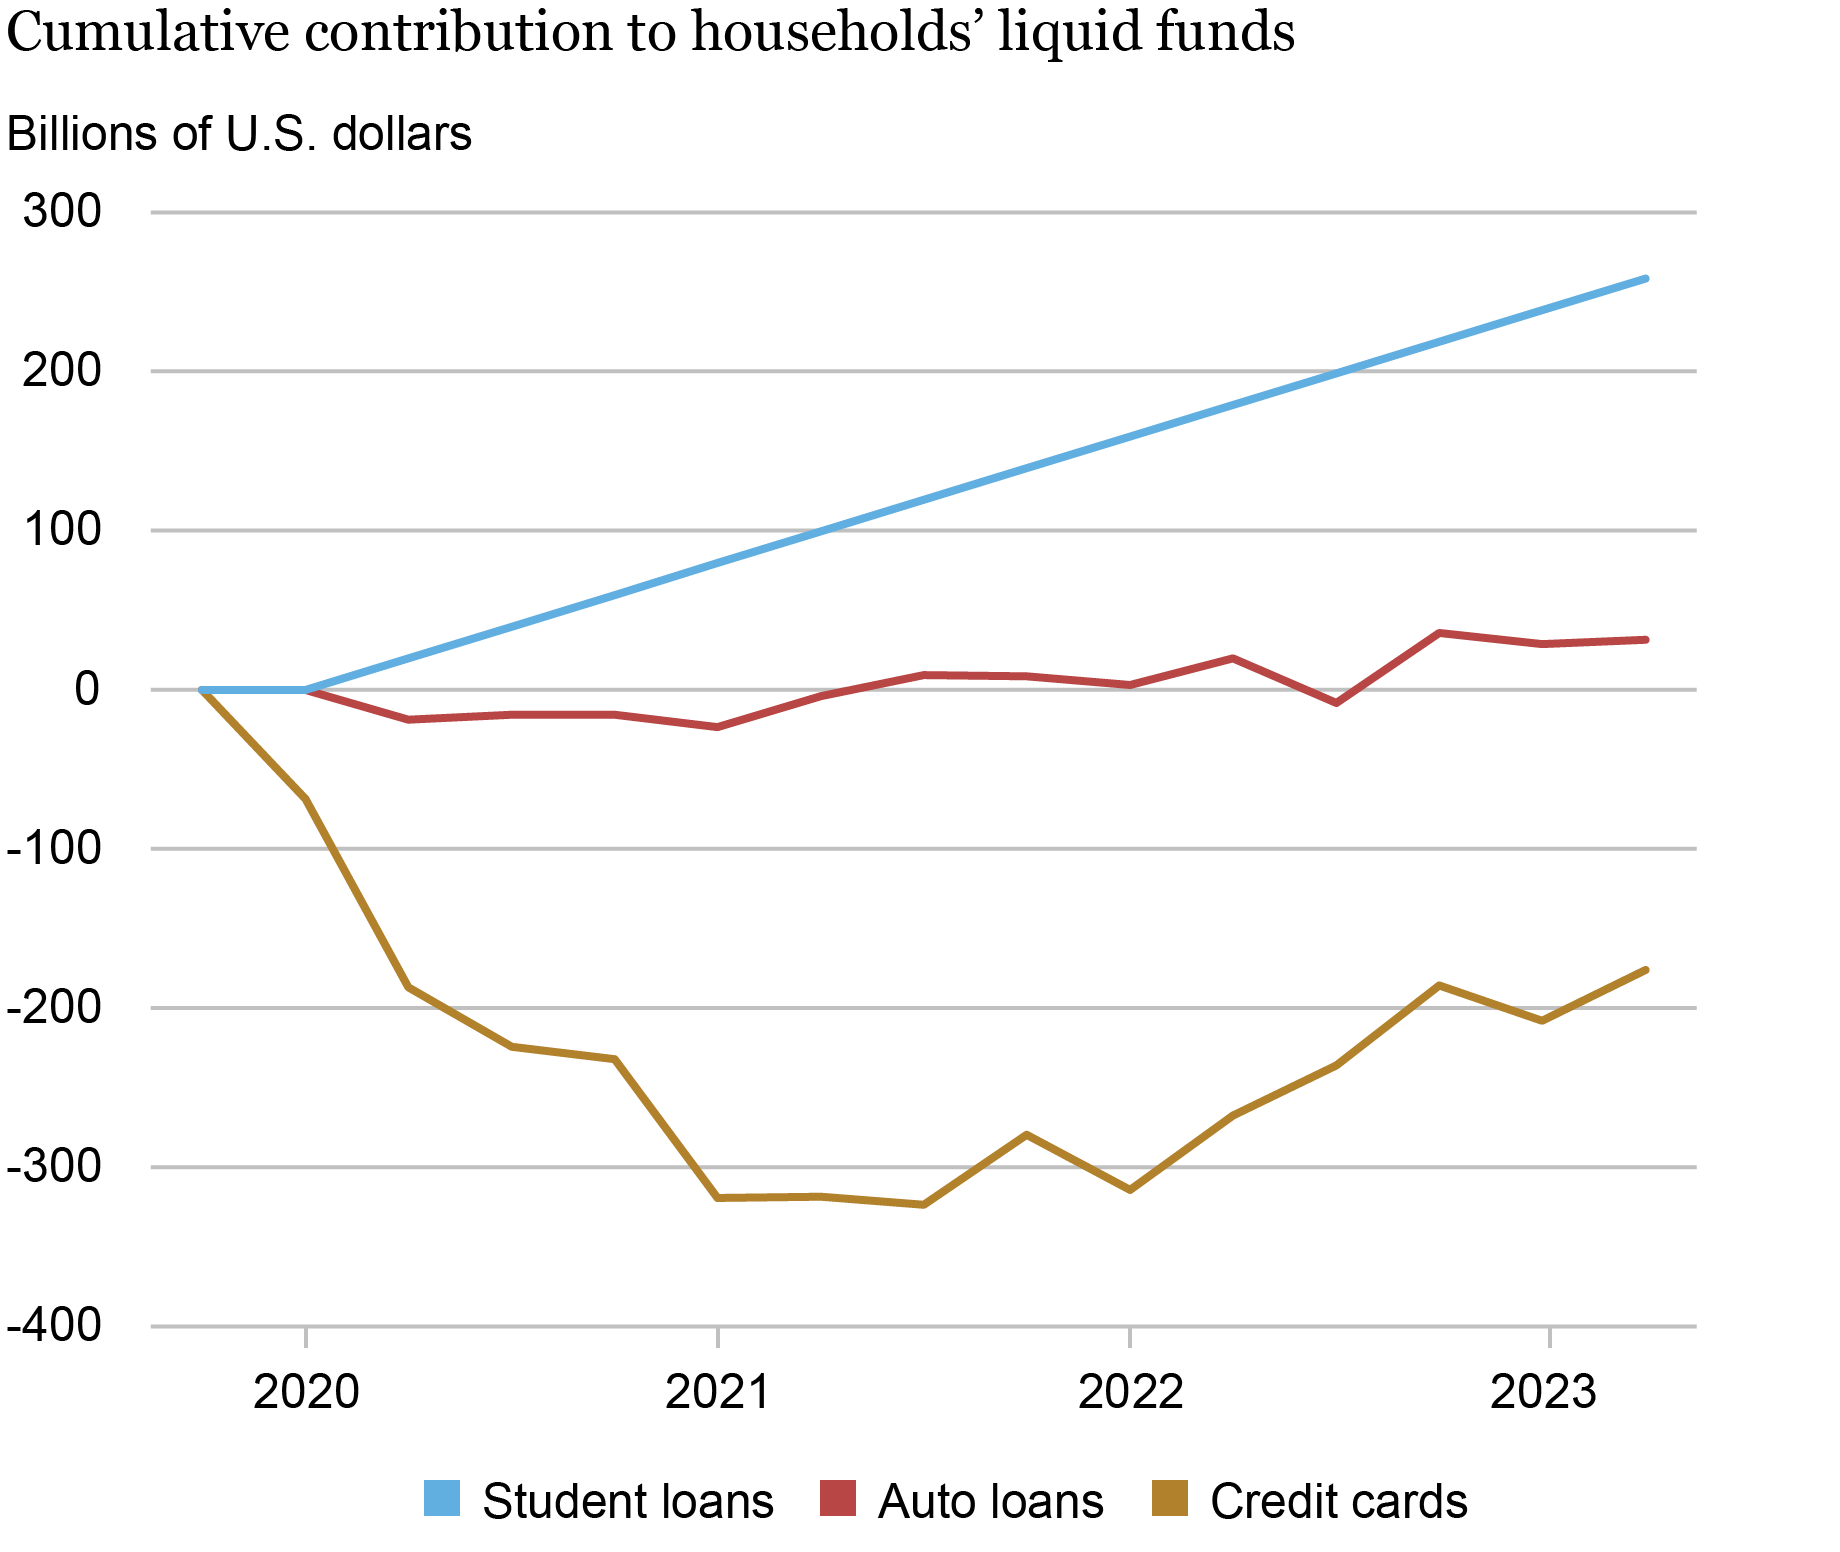
Source: New York Fed Consumer Credit Panel / Equifax.
In total, mortgages—through equity extraction and lower interest payments—have provided about $400 billion of the excess savings since 2019, and nonmortgage debt has added about $110 billion as the positive cash flow from student loans is partly offset by the negative cash flow of credit cards. Of course, reduced credit card balances position households well for future consumption: since reduced balances typically mean that more credit is available for future use.
Other Indicators of Households’ Financial Health
These positive cash flows from debt suggest that the household sector is in a strong position. Other indicators also support this assessment. Debt delinquencies are generally low, led by remarkably low mortgage delinquencies (shown in gold in the next chart). Auto loan and credit card delinquencies, on the other hand, have risen fairly sharply from their troughs during the pandemic and are now back to their 2019 levels. A key question going forward is whether these delinquency rates will level off or continue to rise. A further increase in delinquencies would indicate that, for at least some households, cash flow has become insufficient to support their financial obligations.
Will Delinquency Rates Continue to Rise?
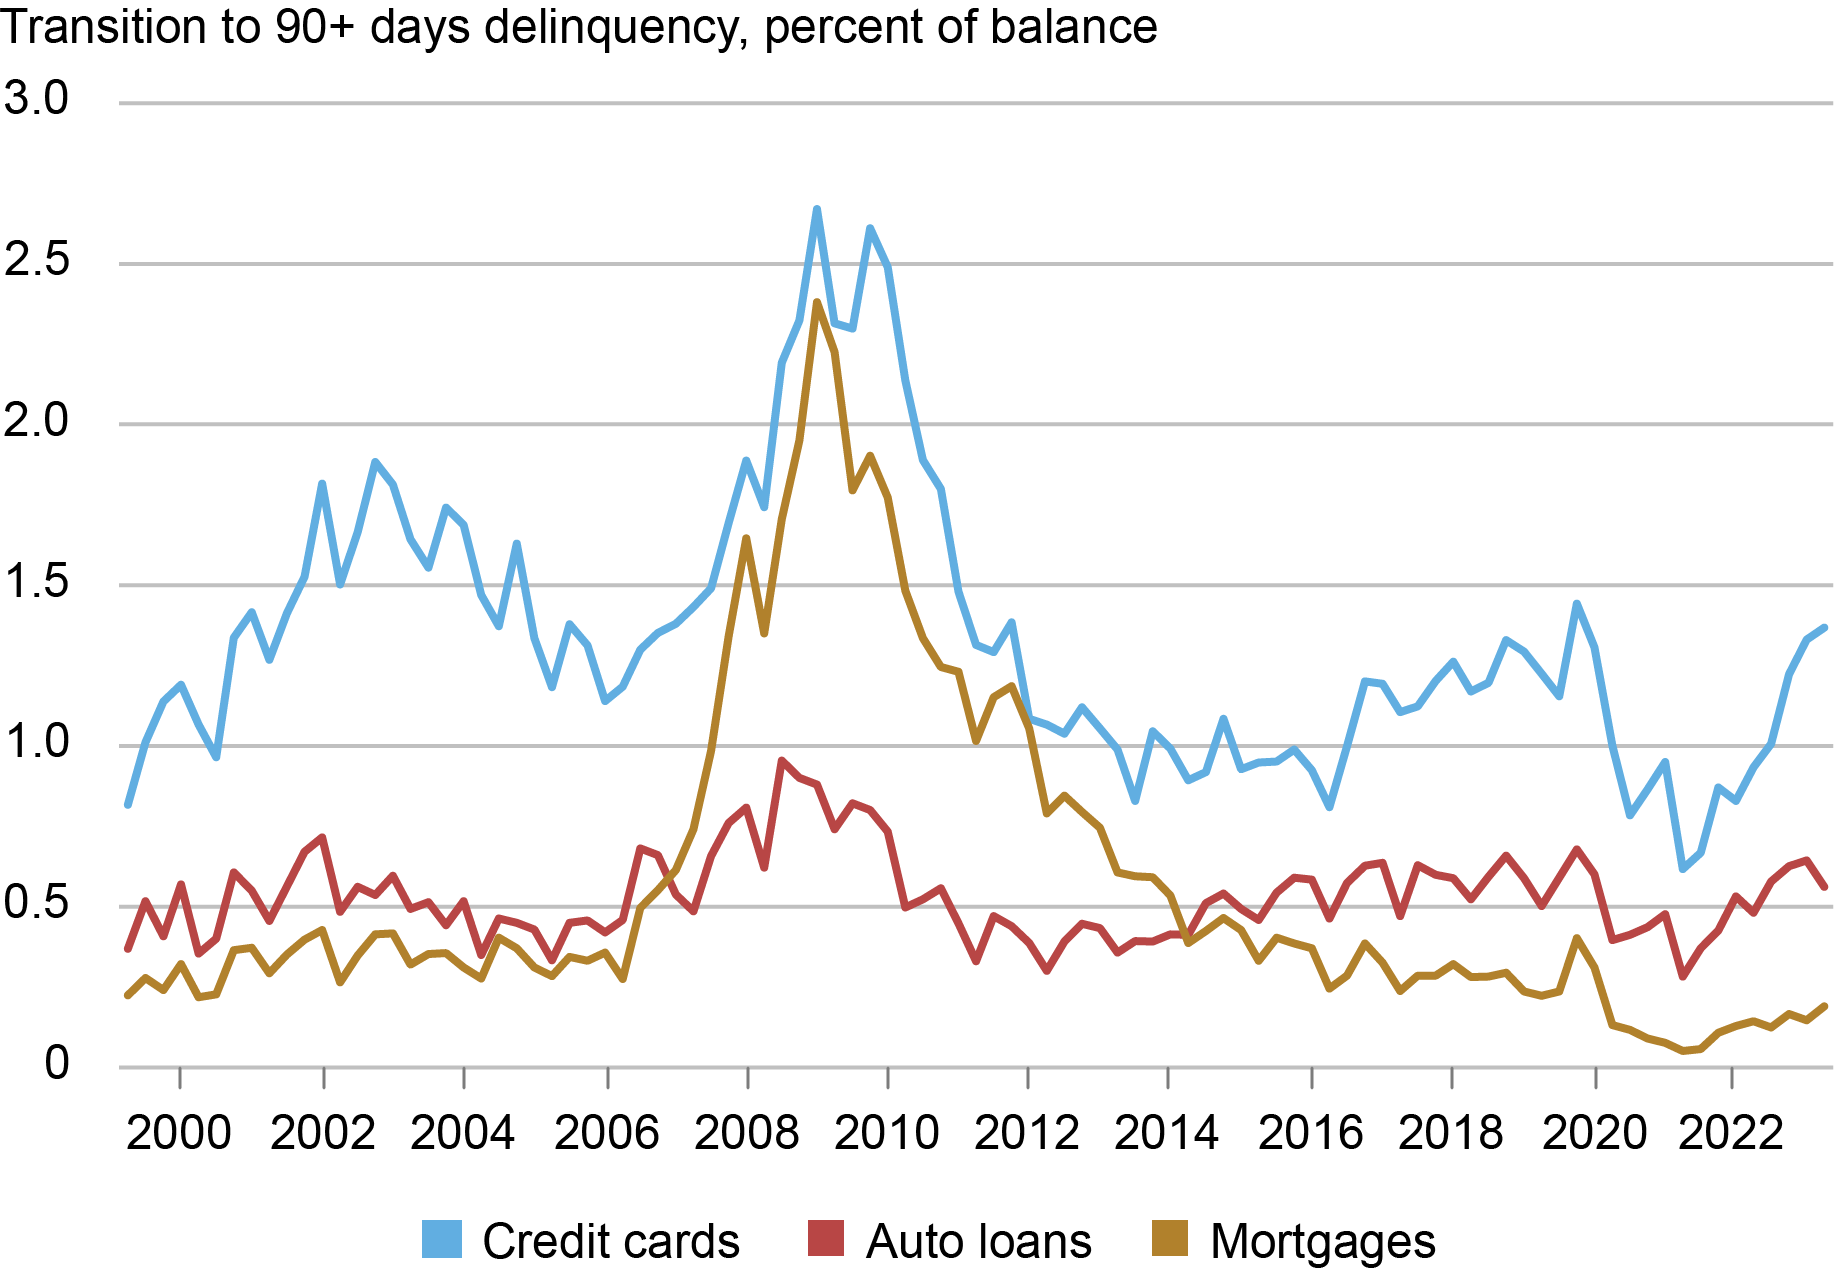
Source: New York Fed Consumer Credit Panel / Equifax.
As a second set of indicators, we use data from the New York Fed’s Survey of Consumer Expectations to assess households’ near-term expectations regarding their spending, debt delinquency, household income, and earnings growth. Median year-ahead expected spending growth has retreated somewhat from its high 2022 levels, but its current reading of 5.3 percent and six-month average of 5.4 percent remain well above its pre-pandemic level in February 2020 of 3.1 percent.
The same pattern is true for median expected household income growth and median expected earnings growth, which have averaged 3.2 percent and 2.9 percent, respectively, in recent months—well above their six-month averages going into the pandemic (2.7 percent and 2.4 percent, respectively). Consistent with these findings, the median probability of missing a debt payment over the next three months has been relatively low and stable over the past six months at an average of 11.3 percent, compared to a six-month average of 12.2 percent going into the pandemic.
What’s Next?
Overall, households report solid and stable expectations for spending growth, consistent with our evidence on the strength and liquidity of household balance sheets, including relatively low delinquencies. Of course, the period of very low interest rates that supported many of these developments is decidedly over, at least for now, suggesting that household finances will likely tighten further in the coming months. Additionally, the resumption of student loan payments could have substantial negative effects on vulnerable households. We will return to this important issue in our accompanying post.

Andrew F. Haughwout is director of Household and Public Policy Research in the Federal Reserve Bank of New York’s Research and Statistics Group.

Donghoon Lee is an economic research advisor in Consumer Behavior Studies in the Federal Reserve Bank of New York’s Research and Statistics Group.

Daniel Mangrum is a research economist in Household and Public Policy Research in the Federal Reserve Bank of New York’s Research and Statistics Group.

Jonathan McCarthy is an economic research advisor in Macroeconomic and Monetary Studies in the Federal Reserve Bank of New York’s Research and Statistics Group.

Davide Melcangi is a research economist in Labor and Product Market Studies in the Federal Reserve Bank of New York’s Research and Statistics Group.

Joelle Scally is a regional economic advisor in the Federal Reserve Bank of New York’s Research and Statistics Group.

Wilbert van der Klaauw is an economic research advisor on Household and Public Policy Research in the Federal Reserve Bank of New York’s Research and Statistics Group.
How to cite this post:
Andrew Haughwout, Donghoon Lee, Daniel Mangrum, Jonathan McCarthy, Davide Melcangi, Joelle Scally, and Wilbert van der Klaauw, “An Update on the Health of the U.S. Consumer,” Federal Reserve Bank of New York Liberty Street Economics, October 18, 2023, https://libertystreeteconomics.newyorkfed.org/2023/10/an-update-on-the-health-of-the-u-s-consumer/
BibTeX: View |

Disclaimer
The views expressed in this post are those of the author(s) and do not necessarily reflect the position of the Federal Reserve Bank of New York or the Federal Reserve System. Any errors or omissions are the responsibility of the author(s).
 RSS Feed
 Follow Liberty Street Economics