


In a 2022 post, we showed how liquidity conditions in the U.S. Treasury securities market had worsened as supply disruptions, high inflation, and geopolitical conflict increased uncertainty about the expected path of interest rates. In this post, we revisit some commonly used metrics to assess how market liquidity has evolved since. We find that liquidity worsened abruptly in March 2023 after the failures of Silicon Valley Bank and Signature Bank, but then quickly improved to levels close to those of the preceding year. As in 2022, liquidity in 2023 continues to closely track the level that would be expected by the path of interest rate volatility.
Importance of Treasury Market Liquidity
The U.S. Treasury securities market is the largest and most liquid government securities market in the world, with more than $25 trillion in marketable debt outstanding (as of August 31, 2023). The securities are used by the Treasury Department to finance the U.S. government, by countless financial institutions to manage interest rate risk and price other financial instruments, and by the Federal Reserve in implementing monetary policy. Having a liquid market is important for all of these purposes and thus of concern to market participants and policymakers alike.
Measuring Liquidity
Liquidity often refers to the cost of quickly converting an asset into cash (or vice versa) and is measured in various ways. We look at three commonly used measures, estimated using high-frequency data from the interdealer market: the bid-ask spread, order book depth, and price impact. The measures are estimated for the most recently auctioned (on-the-run) two-, five-, and ten-year notes (the three most actively traded Treasury securities, as shown in this Liberty Street Economics post), and are calculated for New York trading hours (defined as 7 a.m. to 5 p.m.).
Market Liquidity Worsened in March 2023
The bid-ask spread—the difference between the lowest ask price and the highest bid price for a security—is one of the most popular liquidity measures. As shown in the chart below, bid-ask spreads widened abruptly after the failures of Silicon Valley Bank (March 10) and Signature Bank (March 13), suggesting reduced liquidity. For the two-year note, spreads exceeded those observed during the COVID-related disruptions of March 2020 (examined in this Liberty Street Economics post). Spreads then narrowed over the subsequent month or so to levels close to those of the preceding year but remained somewhat elevated for the two-year note.
Bid-Ask Spreads Widened in March 2023
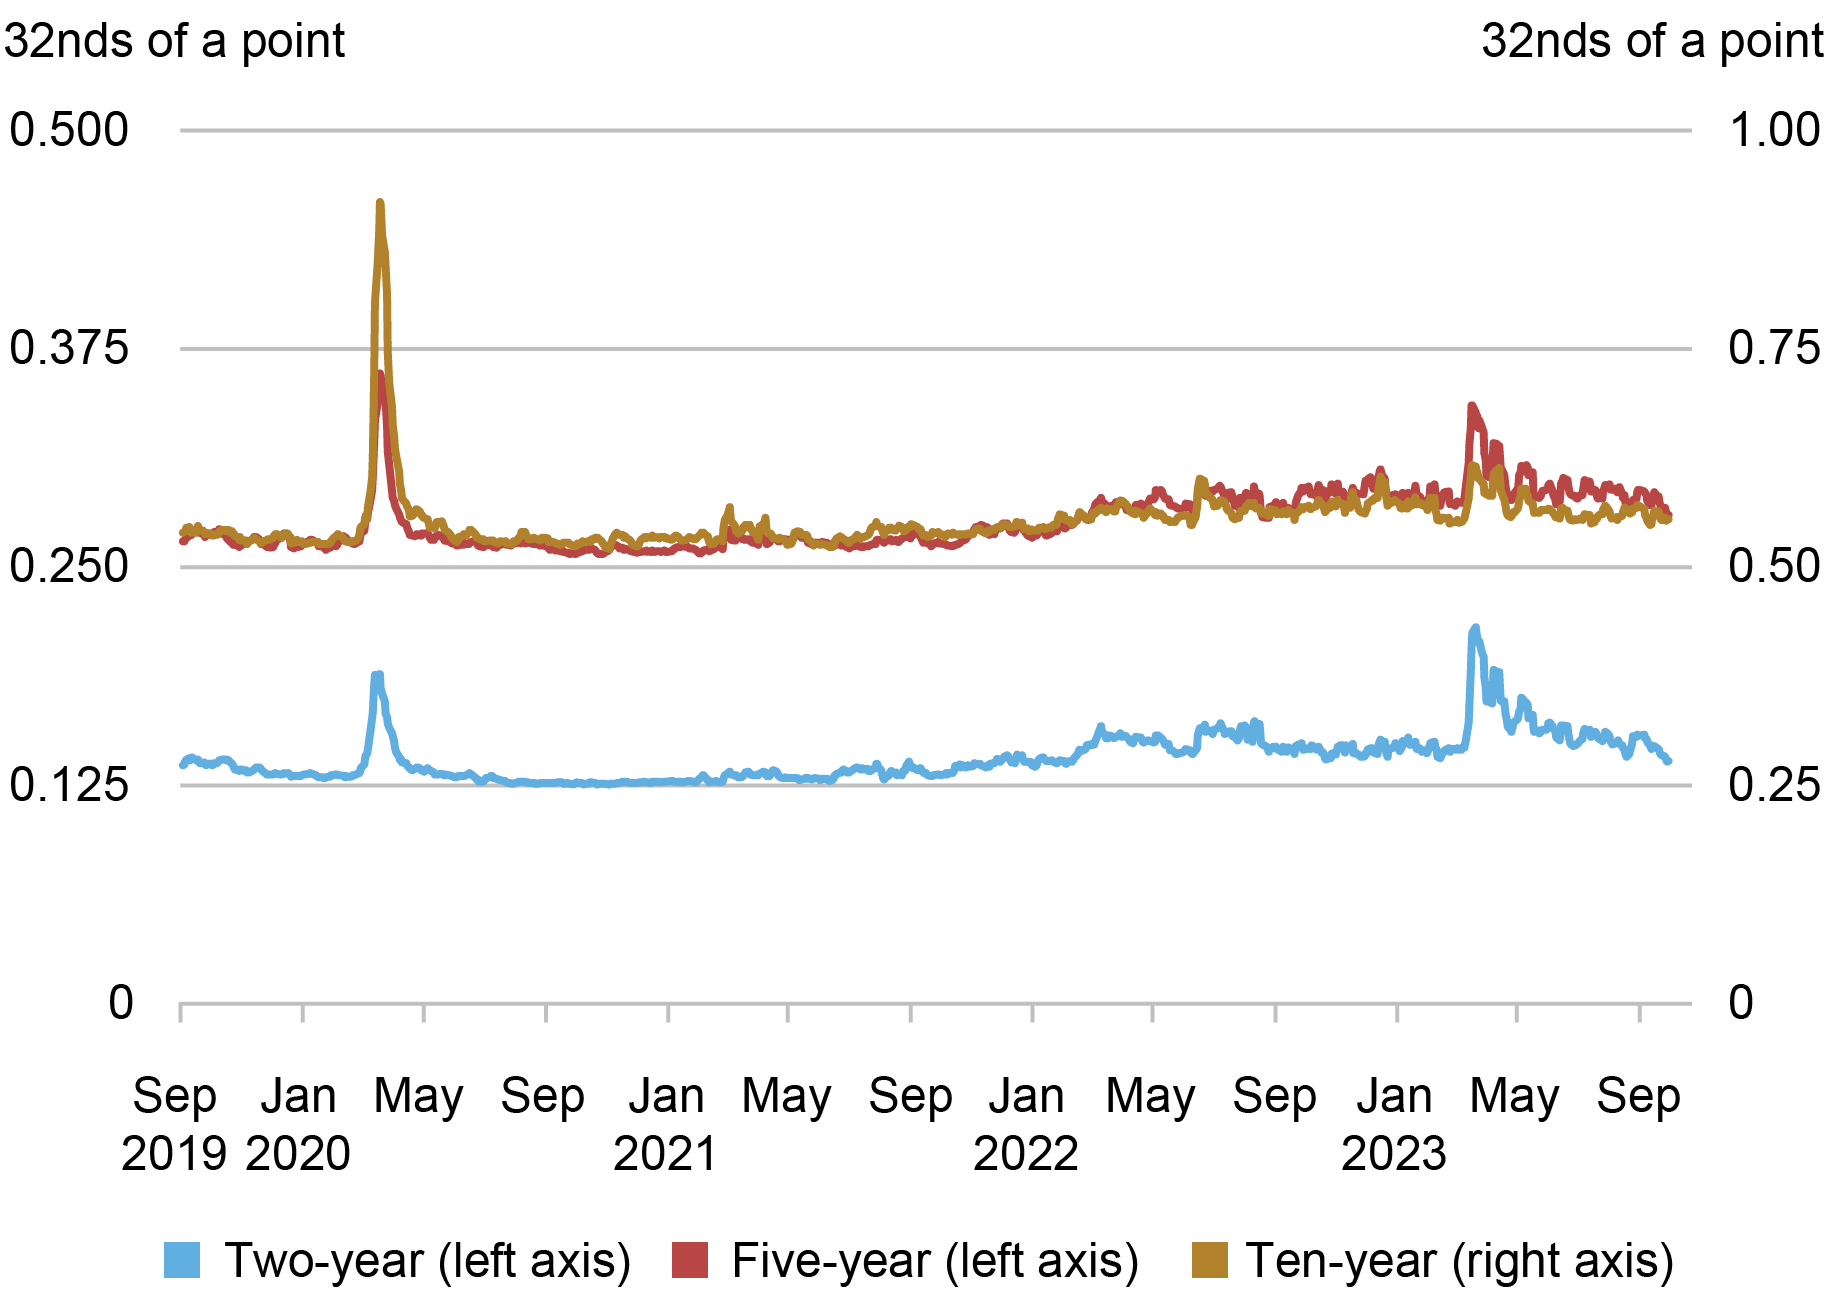
Source: Author’s calculations, based on data from BrokerTec.
Notes: The chart plots five-day moving averages of average daily bid-ask spreads for the on-the-run two-, five-, and ten-year notes in the interdealer market from September 1, 2019 to September 30, 2023. Spreads are measured in 32nds of a point, where a point equals one percent of par.
The next chart plots order book depth, measured as the average quantity of securities available for sale or purchase at the best bid and offer prices. This metric again points to relatively poor liquidity in March 2023, as the available depth declined precipitously. Depth in the five-year note was at levels commensurate with those of March 2020, whereas depth in the two-year note was appreciably lower—and depth in the ten-year note appreciably higher—than the levels of March 2020. Within about a month, depth for all three notes was back to levels similar to those of the preceding year.
Order Book Depth Plunged in March 2023
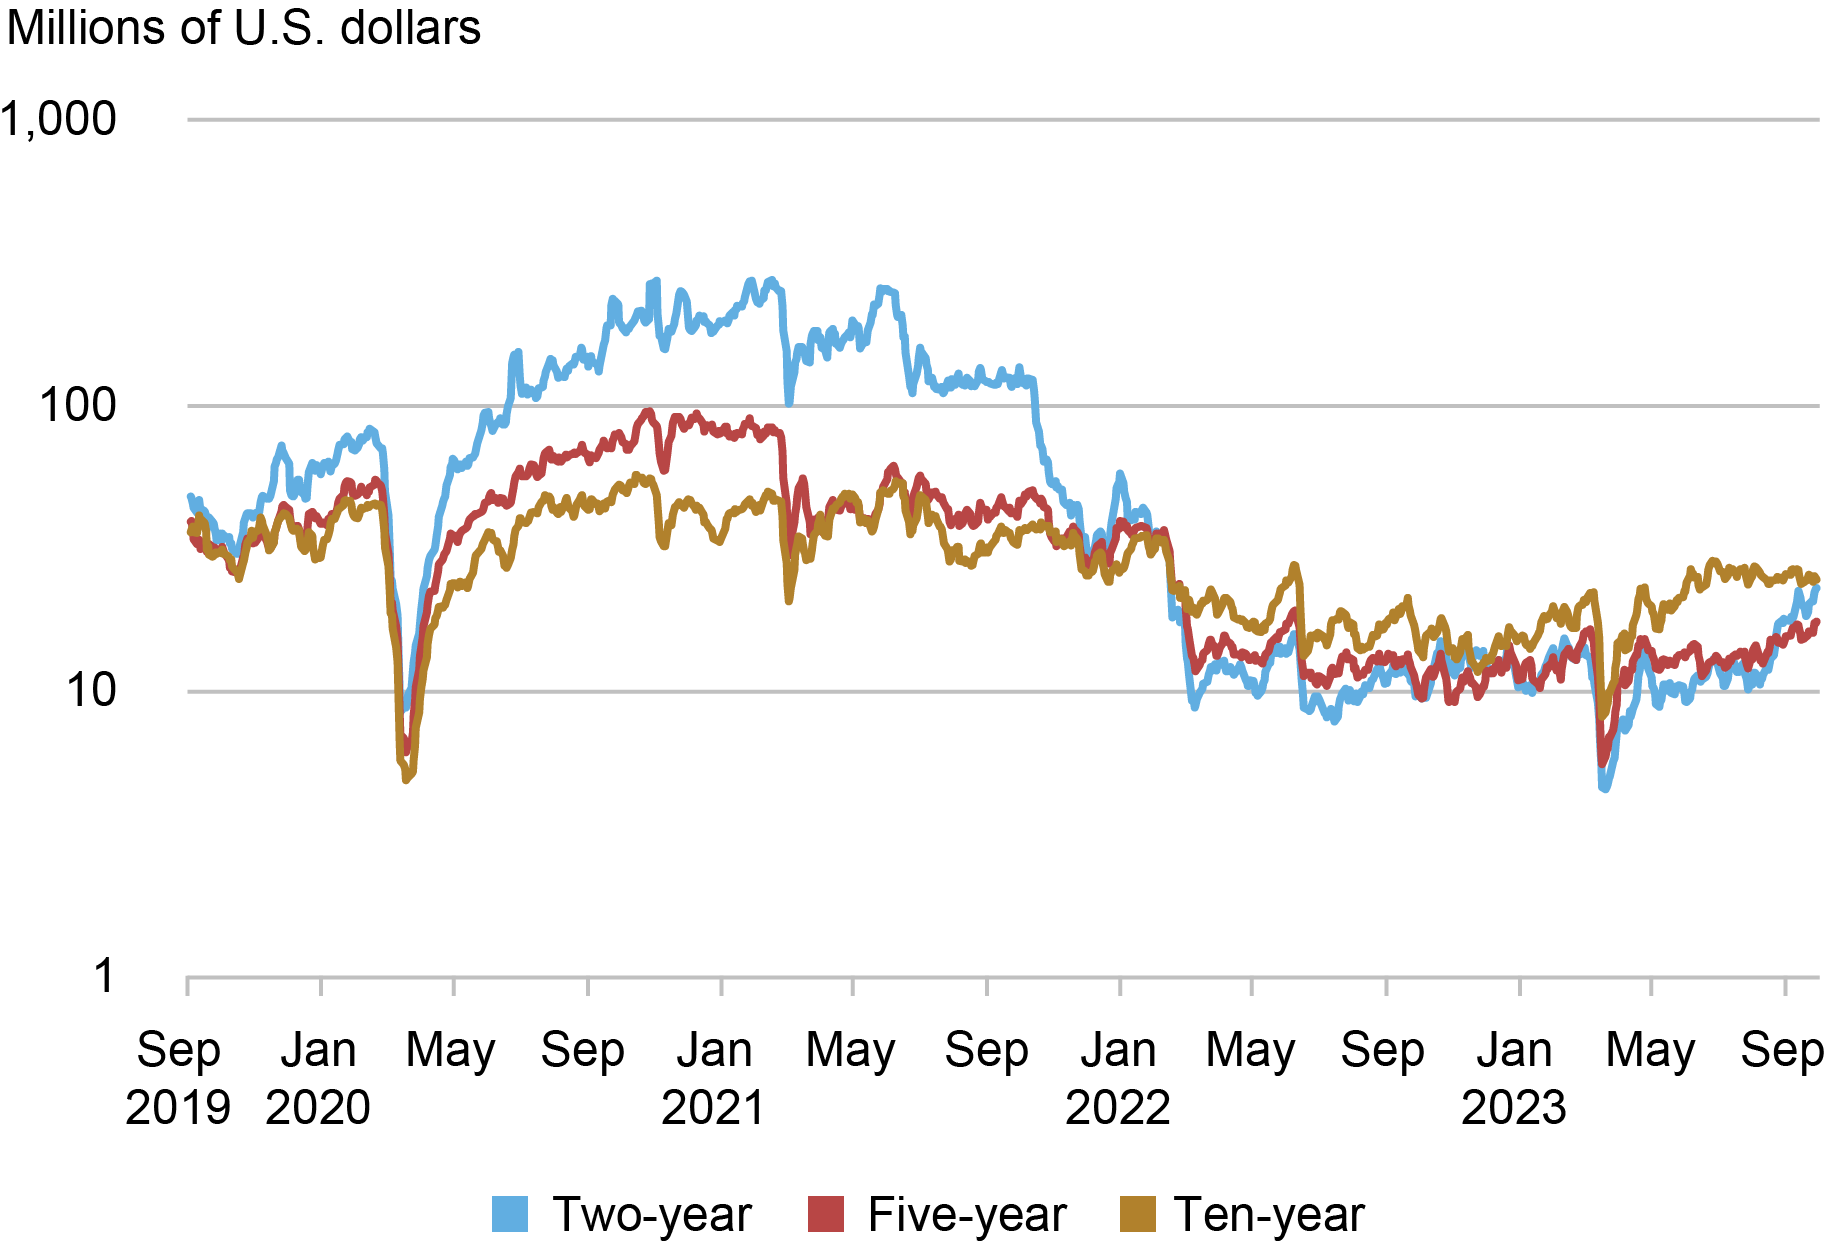
Source: Author’s calculations, based on data from BrokerTec.
Notes: This chart plots five-day moving averages of average daily depth for the on-the-run two-, five-, and ten-year notes in the interdealer market from September 1, 2019 to September 30, 2023. Data are for order book depth at the inside tier, averaged across the bid and offer sides. Depth is measured in millions of U.S. dollars par and plotted on a logarithmic scale.
Measures of the price impact of trades also suggest a notable deterioration of liquidity. The next chart plots the estimated price impact per $100 million in net order flow (defined as buyer-initiated trading volume less seller-initiated trading volume). A higher price impact suggests reduced liquidity. Price impact for the two-year note rose sharply in March 2023 to a level about twice as high as at its March 2020 peak, and then within a month or so returned to levels comparable to those of the preceding year. Price impact for the five-and ten-year notes rose more modestly in March.
Price Impact Rose in March 2023
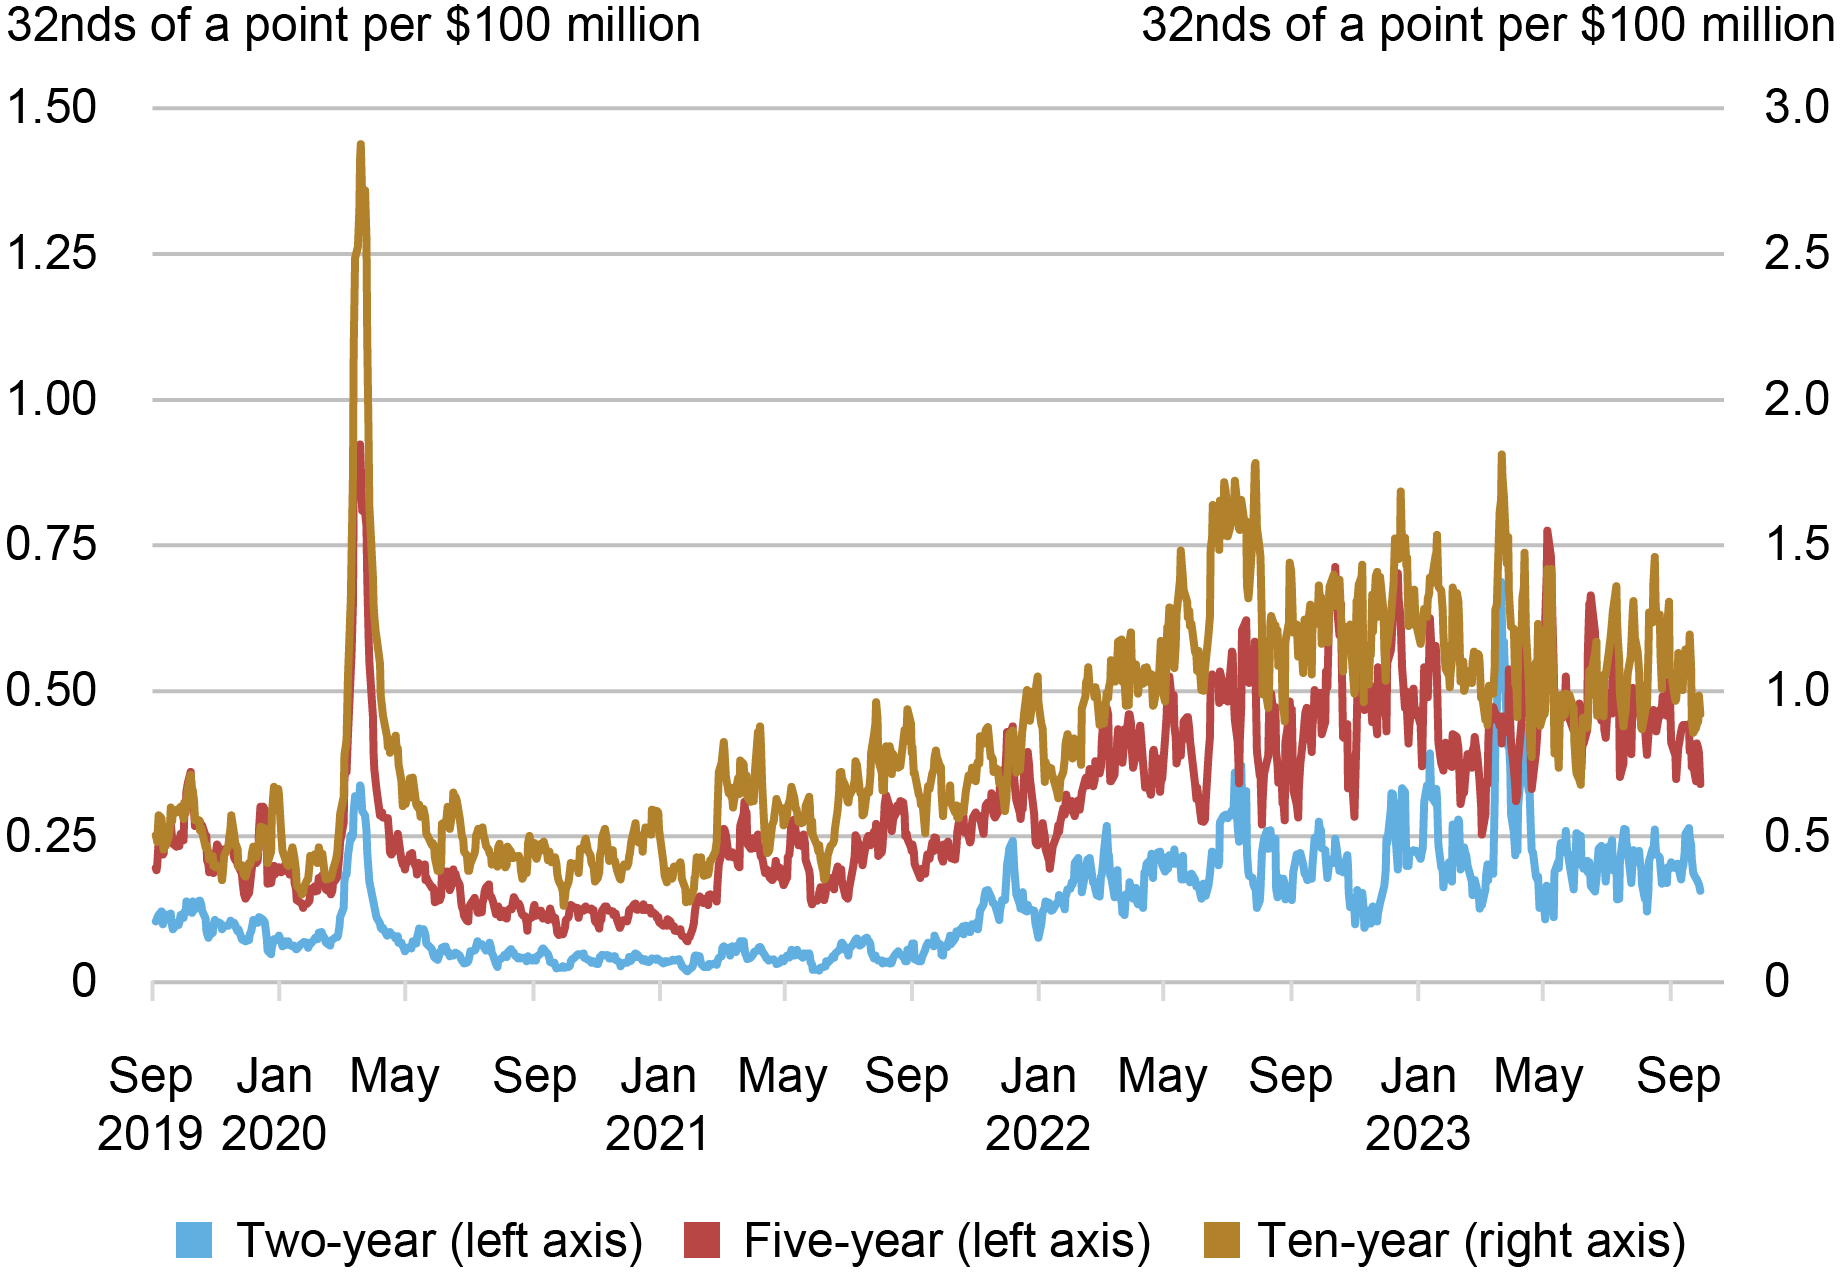
Source: Author’s calculations, based on data from BrokerTec.
Notes: The chart plots five-day moving averages of slope coefficients from daily regressions of one-minute price changes on one-minute net order flow (buyer-initiated trading volume less seller-initiated trading volume) for the on-the-run two-, five-, and ten-year notes in the interdealer market from September 1, 2019 to September 30, 2023. Price impact is measured in 32nds of a point per $100 million, where a point equals one percent of par.
Volatility Spiked in March 2023
The failures of Silicon Valley Bank and Signature Bank increased uncertainty about the economic outlook and expected path of interest rates. Interest rate volatility increased sharply as a result, as shown in the next chart, with two-year note volatility in particular reaching levels more than twice as high as in March 2020. Volatility causes market makers to widen their bid-ask spreads and post less depth at any given price to manage the increased risk of taking on positions, producing a negative relationship between volatility and liquidity. The sharp rise in volatility and its subsequent decline hence help explain the observed patterns in the liquidity measures.
Price Volatility Spiked in March 2023
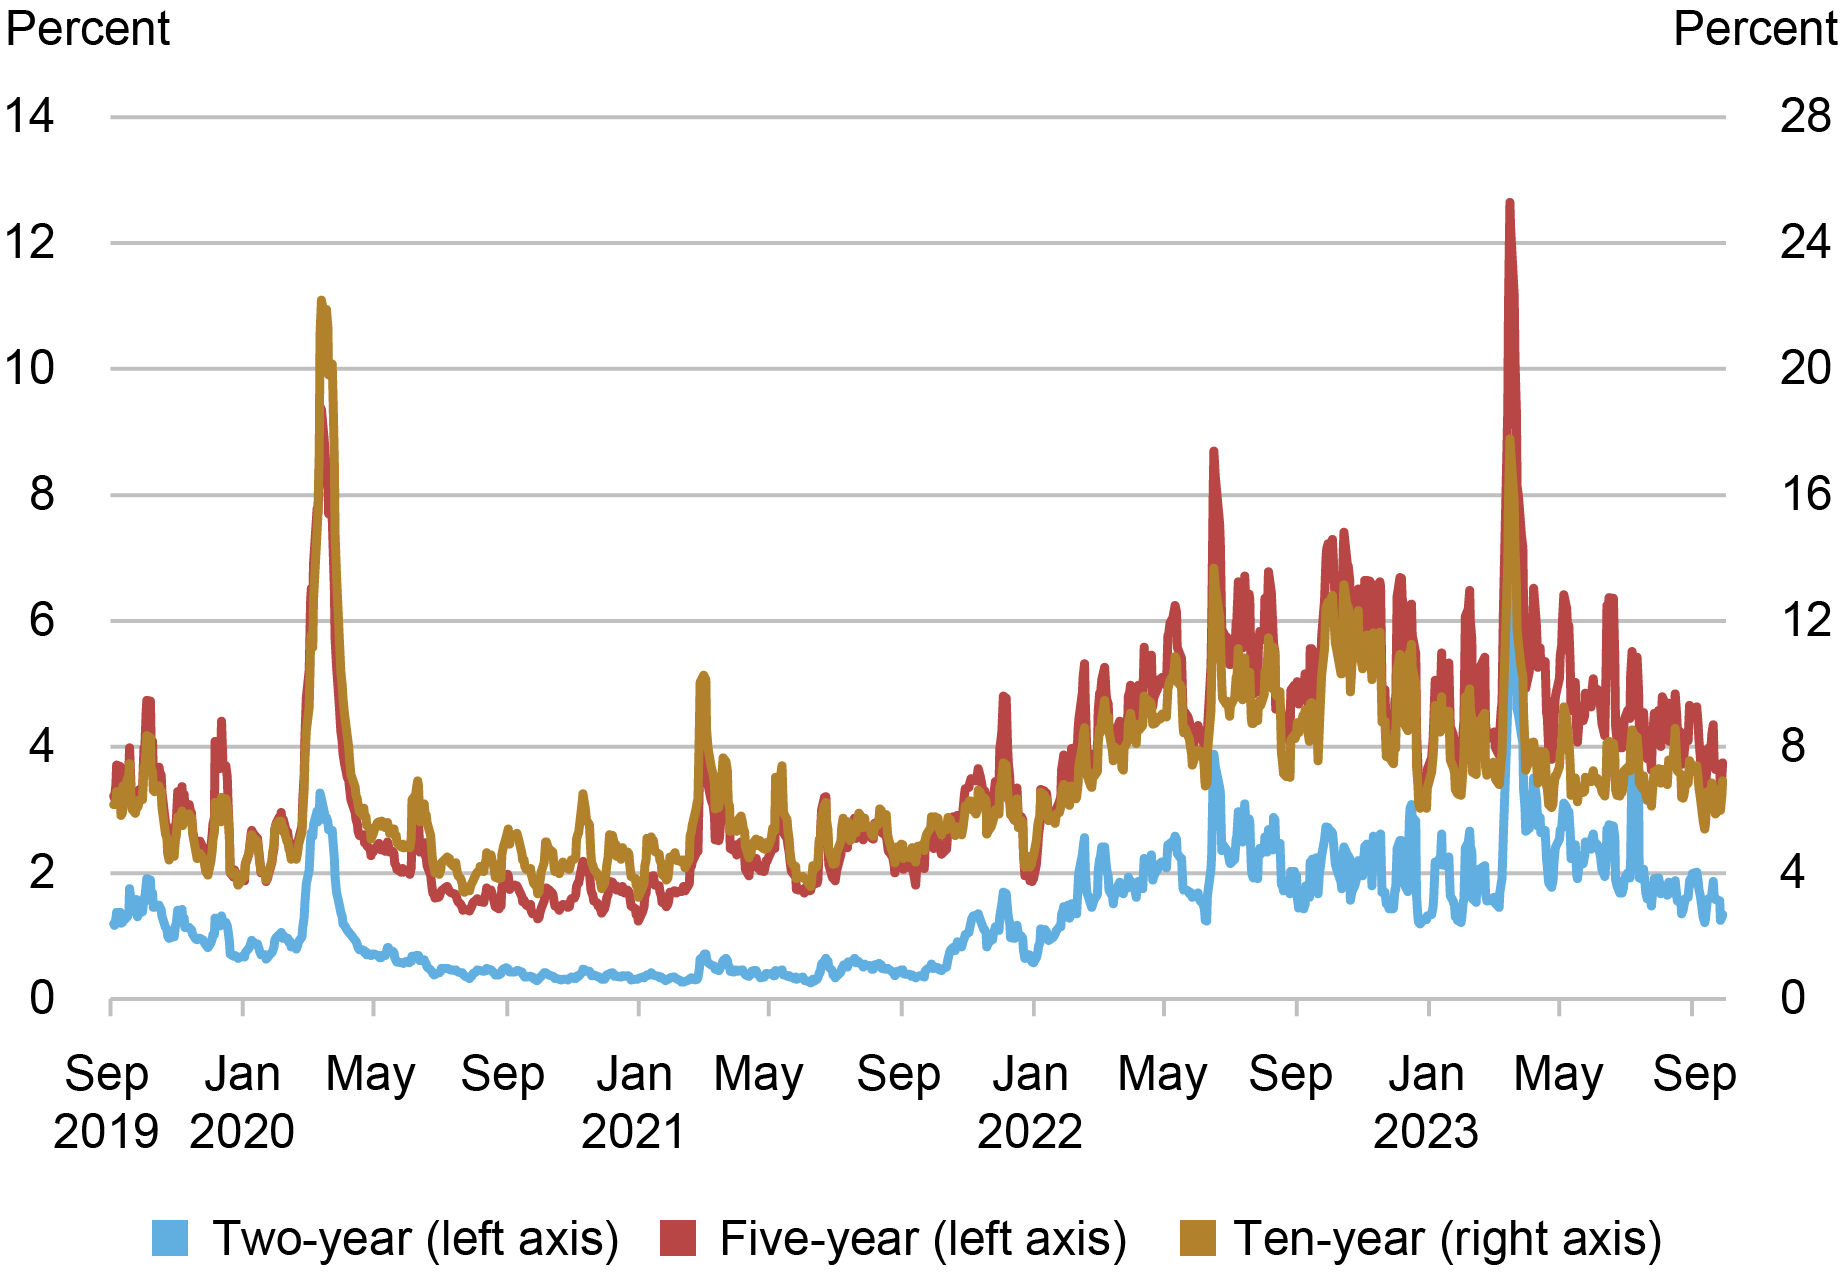
Source: Author’s calculations, based on data from BrokerTec.
Notes: The chart plots five-day moving averages of price volatility for the on-the-run two-, five-, and ten-year notes in the interdealer market from September 1, 2019 to September 30, 2023. Price volatility is calculated for each day by summing squared one-minute returns (log changes in midpoint prices) from 7 a.m. to 5 p.m., annualizing by multiplying by 252, and then taking the square root. It is reported in percent.
Liquidity Continues to Track Volatility
As in “How Liquid Has the Treasury Market Been in 2022?,” we assess whether liquidity has been unusual given the level of volatility by examining scatter plots of price impact against volatility. The chart below provides such a plot for the five-year note, showing that the 2023 observations (in gray) fall in line with the historical relationship. That is, the association between liquidity and volatility in 2023 has been consistent with the past association between these two variables. This is true for the ten-year note as well, whereas for the two-year note the evidence points to somewhat higher-than-expected price impact given the volatility (as also occurred in fall 2008, March 2020, and 2022).
Liquidity in Line with Historical Relationship with Volatility
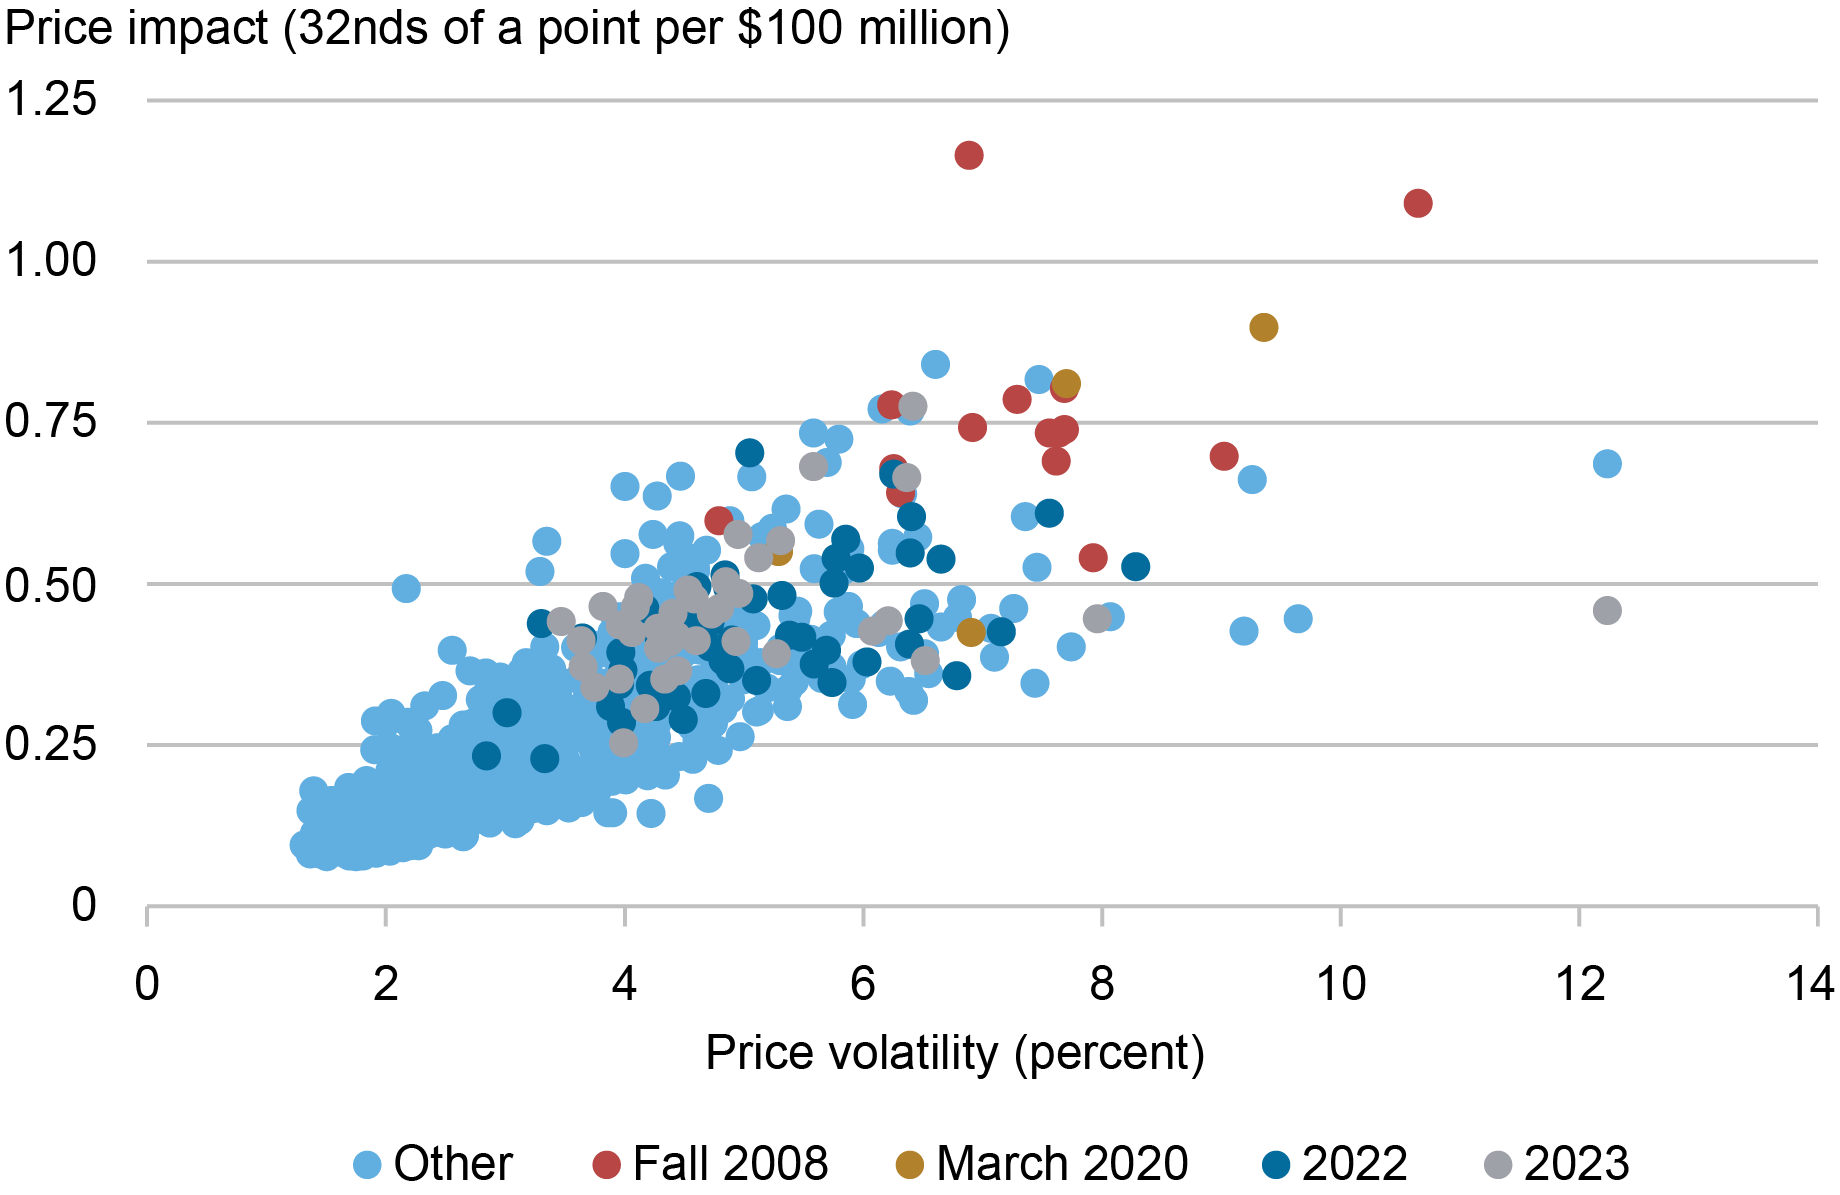
Notes: This chart plots price impact against price volatility by week for the on-the-run five-year note from January 1, 2005, to September 30, 2023. The weekly measures for both series are averages of the daily measures plotted in the preceding two charts. Fall 2008 points are for September 21, 2008–January 3, 2009, March 2020 points are for March 1, 2020–March 28, 2020, 2022 points are for January 1, 2022–December 31, 2022, and 2023 points are for January 1, 2023–September 30, 2023.
The preceding analysis is based on realized price volatility—that is, on how much prices are actually changing. We repeated the analysis with implied (or expected) interest rate volatility, as measured by the ICE BofAML MOVE Index, and found similar results for 2023. That is, liquidity for the five- and ten-year notes is in line with the historical relationship between liquidity and expected volatility, whereas liquidity is somewhat worse for the two-year note.
Continued Vigilance
While Treasury market liquidity has not been unusually poor given the level of interest rate volatility, continued vigilance by policymakers and market participants is appropriate. The market’s capacity to smoothly handle large trading flows has been of concern since March 2020, as discussed in this Brookings paper. Moreover, new empirical work shows how constraints on intermediation capacity can exacerbate illiquidity. Careful monitoring of Treasury market liquidity, and continued efforts to enhance the market’s resilience, are warranted.

Michael J. Fleming is the head of Capital Markets Studies in the Federal Reserve Bank of New York’s Research and Statistics Group.
How to cite this post:
Michael Fleming, “How Has Treasury Market Liquidity Evolved in 2023?,” Federal Reserve Bank of New York Liberty Street Economics, October 17, 2023, https://libertystreeteconomics.newyorkfed.org/2023/10/how-has-treasury-market-liquidity-evolved-in-2023/
BibTeX: View |


Disclaimer
The views expressed in this post are those of the author(s) and do not necessarily reflect the position of the Federal Reserve Bank of New York or the Federal Reserve System. Any errors or omissions are the responsibility of the author(s).
 RSS Feed
 Follow Liberty Street Economics