


147 posts on "Pandemic"
August 7, 2024
The Anatomy of Labor Demand Pre‑ and Post‑COVID

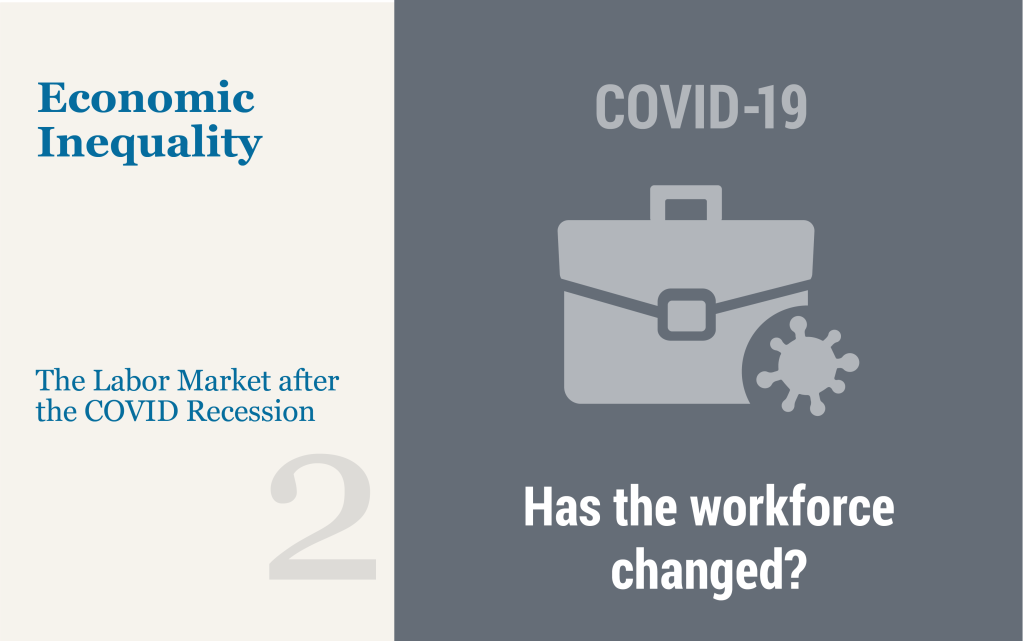
Has labor demand changed since the COVID-19 pandemic? In this post, we leverage detailed data on the universe of U.S. online job listings to study the dynamics of labor demand pre- and post-COVID. We find that there has been a significant shift in listings out of the central cities and into the “fringe” portion of large metro areas, smaller metro areas, and rural areas. We also find a substantial decline in job listings in computer and mathematical and business and financial operations occupations, and a corresponding increase in job openings in sales, office and administrative support, food preparation, and especially healthcare occupations. These patterns (by geography and by occupation) are interconnected: the biggest declines in job listings by occupation occurred in the largest and densest geographies, and the strongest increases in job listings by occupation occurred in the smaller and less populated geographies.
June 28, 2024
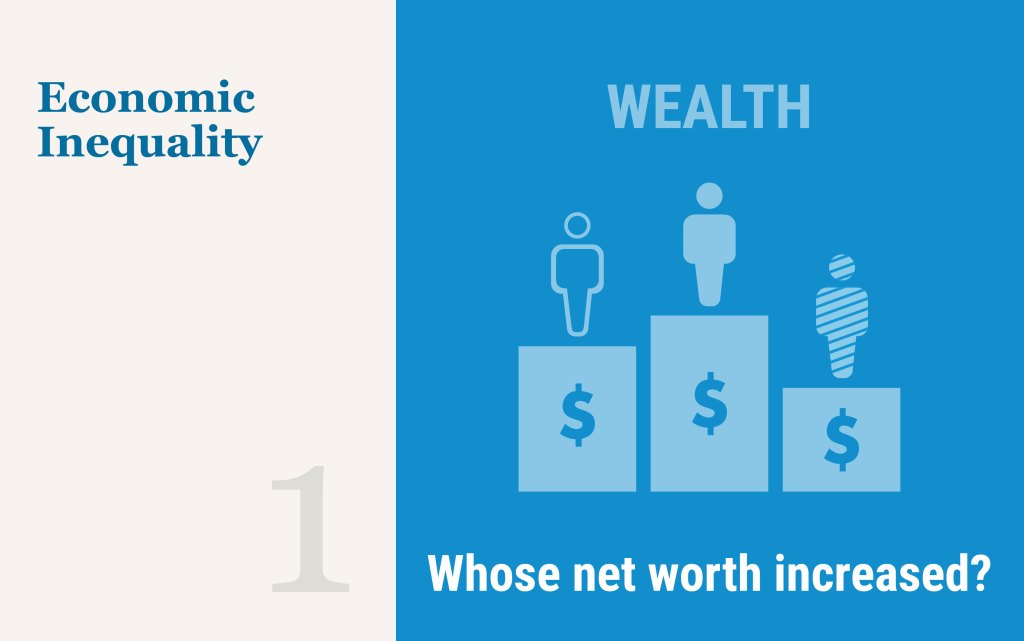
Racial and Ethnic Inequalities in Household Wealth Persist

Disparities in wealth are pronounced across racial and ethnic groups in the United States. As part of an ongoing series on inequality and equitable growth, we have been documenting the evolution of these gaps between Black, Hispanic, and white households, in this case from the first quarter of 2019 to the fourth quarter of 2023 for a variety of assets and liabilities for a pandemic-era picture. We find that real wealth grew and that the pace of growth for Black, Hispanic, and white households was very similar across this timeframe—yet gaps across groups persist.
May 7, 2024
Many Places Still Have Not Recovered from the Pandemic Recession

More than four years have passed since the onset of the pandemic, which resulted in one of the sharpest and deepest economic downturns in U.S. history. While the nation as a whole has recovered the jobs that were lost during the pandemic recession, many places have not. Indeed, job shortfalls remain in more than a quarter of the country’s metro areas, including many in the New York-Northern New Jersey region. In fact, while employment is well above pre-pandemic levels in Northern New Jersey, jobs have only recently recovered in and around New York City, and most of upstate New York—like much of the Rust Belt—still has not fully recovered and has some of the largest job shortfalls in the country.
Posted at 11:00 am in Labor Market, New Jersey, New York, Pandemic, Recession, Regional Analysis | Permalink | Comments (1)
February 7, 2024
Racial and Ethnic Wealth Inequality in the Post‑Pandemic Era
Editor’s note: Since this post was first published, the authors updated their analysis to focus on the household level of wealth rather than the aggregate level. Please refer to the new blog post and findings here Racial and Ethnic Inequalities in Household Wealth Persist. (June 28, @ 7:19am)
Wealth is unevenly distributed across racial and ethnic groups in the United States. In this first post in a two-part series on wealth inequality, we use the Distributional Financial Accounts (DFA) to document these disparities between Black, Hispanic, and white households from the first quarter of 2019 to the third quarter of 2023 for wealth and a variety of asset and liability categories. We find that these disparities have been exacerbated since the pandemic, likely due to rapid growth in the financial assets more often held by white individuals.
Posted at 10:00 am in Demographics, Financial Markets, Inequality, Pandemic | Permalink | Comments (2)
February 6, 2024
Auto Loan Delinquency Revs Up as Car Prices Stress Budgets

The New York Fed’s Center for Microeconomic Data released the Quarterly Report on Household Debt and Credit for the fourth quarter of 2023 this morning. Household debt balances grew by $212 billion over the last quarter. Although there was growth across most loan types, it was moderate compared to the fourth-quarter changes seen in the past few years. Mortgage balances grew by $112 billion and home equity line of credit (HELOC) balances saw an $11 billion bump as borrowers tapped home equity in lieu of refinancing first mortgages. Credit card balances, which typically see substantial increases in the fourth quarter coinciding with holiday spending, grew by $50 billion, and are now 14.5 percent higher than in the fourth quarter of 2022. Auto loan balances saw a $12 billion increase from the previous quarter, continuing the steady growth that has been in place since 2011. In this post, we revisit our analysis on credit cards and examine which groups are struggling with their auto loan payments. The Quarterly Report and this analysis are based on the New York Fed Consumer Credit Panel (CCP), a panel which is drawn from Equifax credit reports.
August 23, 2023
Businesses Want Remote Work, Just Not as Much

The enormous increase in remote work that occurred during the pandemic was a response to a temporary public health crisis. Now that the pandemic has passed, just how much remote work will persist and how much are businesses comfortable with? Results from our August regional business surveys indicate that more than 20 percent of all service work and 4 percent of all manufacturing work is currently being done remotely, nearly identical to what was reported a year ago, and this amount of remote work is expected to persist in the year ahead. However, on average, service sector businesses would prefer that about 15 percent of work be done remotely. Indeed, nearly a quarter of service firms have increased requirements for employees to work on-site over the past year and about one in six plan to make further adjustments toward in-person work next year. Ultimately, the degree and persistence of remote work will largely depend on the tightness of the labor market, as businesses report that while remote work does have its downsides, it has been particularly helpful for attracting and retaining workers.
August 9, 2023
The Post‑Pandemic r*

The debate about the natural rate of interest, or r*, sometimes overlooks the point that there is an entire term structure of r* measures, with short-run estimates capturing current economic conditions and long-run estimates capturing more secular factors. The whole term structure of r* matters for policy: shorter run measures are relevant for gauging how restrictive or expansionary current policy is, while longer run measures are relevant when assessing terminal rates. This two-post series covers the evolution of both in the aftermath of the pandemic, with today’s post focusing especially on long-run measures and tomorrow’s post on short-run r*.
April 13, 2023
The Tri‑State Region’s Recovery from the Pandemic Recession Three Years On

The tri-state region’s economy was hit especially hard by the pandemic, but three years on, is close to recovering the jobs that were lost. Indeed, employment initially fell by 20 percent in New York City as the pandemic took hold, a significantly sharper decline than for the nation as a whole, and the rest of the region experienced similar declines, creating a much larger hole than in other parts of the country. Three years later, the recovery has been uneven: Recent job growth has been particularly strong in New York City, where employment remains just slightly below pre-pandemic levels, and in Northern New Jersey, which has more than recovered all of the jobs lost early in the pandemic. But it has been sluggish in downstate New York outside of New York City, and in upstate New York, and employment across the region has clearly not reached the level implied by pre-pandemic trends. A dearth of available workers remains a significant constraint on growth in the region, particularly in upstate New York, which had already been suffering from a lack of workers well before the pandemic began
October 20, 2022
Long COVID Appears to Have Led to a Surge of the Disabled in the Workplace
Although most of those infected with COVID-19 have recovered relatively quickly, a substantial share has not, and remains symptomatic months or even years later, in what is commonly referred to as long COVID. Data on the incidence of long COVID is scarce, but recent Census Bureau data suggest that sixteen million working age Americans suffer from it. The economic costs of long COVID is estimated to be in the trillions. While many with long COVID have dropped out of the labor force because they can no longer work, many others appear to be working despite having disabilities related to the disease. Indeed, there has been an increase of around 1.7 million disabled persons in the U.S. since the pandemic began, and there are close to one million newly disabled workers. These disabled workers can benefit from workplace accommodations to help them remain productive and stay on the job, particularly as the majority deal with fatigue and brain fog, the hallmarks of long COVID.
Posted at 7:02 am in Equitable Growth, Inequality, Labor Market, Pandemic | Permalink | Comments (2)
October 18, 2022
What Have Workers Done with the Time Freed up by Commuting Less?

The COVID-19 pandemic has dramatically changed the way Americans spend their time. One of the most enduring shifts has occurred in the workplace, with millions of employees making the switch to work from home. Even as the pandemic has waned, more than 15 percent of full-time employees remain fully remote and an additional 30 percent work in hybrid arrangements (Barrero, Bloom, and Davis). These changes have substantially reduced time spent commuting to work; in the aggregate, Americans now spend 60 million fewer hours traveling to work each day. In this post, we investigate how people spend this saved time on other activities. Using detailed data from the American Time Use Survey (ATUS), we find that employed individuals allocate their saved commute time toward leisure activities and sleeping, while reducing overall work hours.
 RSS Feed
 Follow Liberty Street Economics