


111 posts on "Crisis"
July 7, 2026
What Do Over 3,000 Bank Runs Teach Us About Banking Crises?
Runs on financial institutions are one of the salient markers of financial crises. But the role of runs in crises is a topic of longstanding debate. Runs can be seen as the key turning point, whereby even small shocks can generate severe crises with widespread bank failures. Another view is that runs are mainly a symptom of deeper rot in the financial system, exacerbating crises rather than being their primary cause. Understanding this debate has first order implications for how to think about financial crises and the appropriate policy responses. In this post, we use a new database of more than 3,000 bank runs (introduced in our companion post) to show that poor fundamentals are central to explaining both when runs occur and when they have severe economic effects. We argue that this evidence tempers the view that small shocks can have outsized real effects through self-fulfilling run dynamics.
Posted at 10:01 am in Artificial Intelligence (AI), Banks, Crisis, Liquidity | Permalink | Comments (1)
Using AI to Let History Speak About Bank Runs

Banking crises are commonly associated with bank runs and banking panics, yet our empirical understanding of bank runs is constrained by a lack of bank-level data. In a new paper, we use large language models (LLMs) to extract information on bank runs from millions of digitized historical newspaper pages, creating the most comprehensive database of bank runs in U.S. history. Every bank run episode that we identify is documented on a companion website where users can browse and examine individual episodes, and read the original newspaper articles. In this post, we describe how we built this dataset and discuss what its basic features reveal.
Posted at 10:00 am in Artificial Intelligence (AI), Banks, Crisis, Liquidity | Permalink | Comments (0)
December 20, 2024
Anatomy of the Bank Runs in March 2023
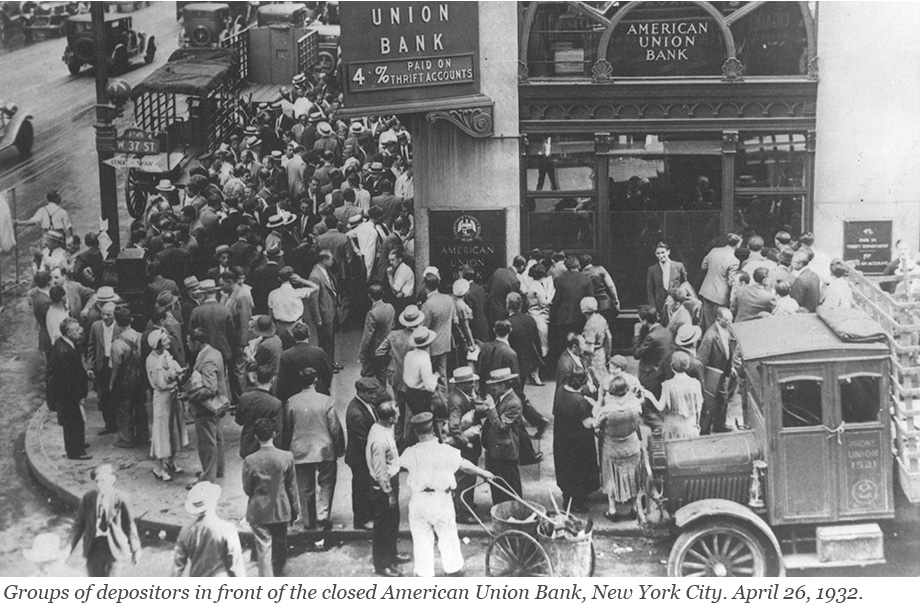
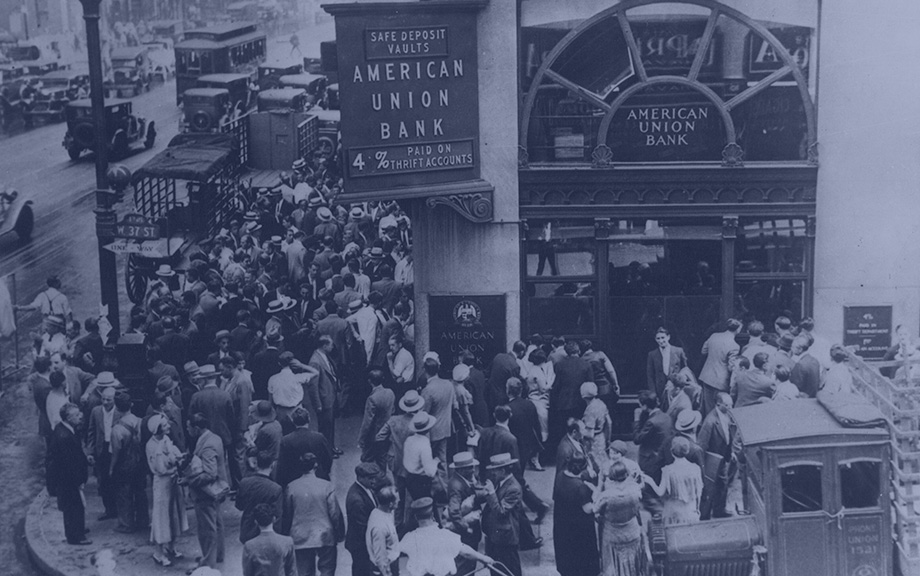
Runs have plagued the banking system for centuries and returned to prominence with the bank failures in early 2023. In a traditional run—such as depicted in classic photos from the Great Depression—depositors line up in front of a bank to withdraw their cash. This is not how modern bank runs occur: today, depositors move money from a risky to a safe bank through electronic payment systems. In a recently published staff report, we use data on wholesale and retail payments to understand the bank run of March 2023. Which banks were run on? How were they different from other banks? And how did they respond to the run?
Posted at 6:30 am in Banks, Crisis, Financial Institutions, Lender of Last Resort, Panic | Permalink | Comments (1)
November 22, 2024
Why Do Banks Fail? The Predictability of Bank Failures

Can bank failures be predicted before they happen? In a previous post, we established three facts about failing banks that indicated that failing banks experience deteriorating fundamentals many years ahead of their failure and across a broad range of institutional settings. In this post, we document that bank failures are remarkably predictable based on simple accounting metrics from publicly available financial statements that measure a bank’s insolvency risk and funding vulnerabilities.
August 12, 2024
Reallocating Liquidity to Resolve a Crisis

Shortly after the collapse of Silicon Valley Bank (SVB) in March 2023, a consortium of eleven large U.S. financial institutions deposited $30 billion into First Republic Bank to bolster its liquidity and assuage panic among uninsured depositors. In the end, however, First Republic Bank did not survive, raising the question of whether a reallocation of liquidity among financial institutions can ever reduce the need for central bank balance sheet expansion in the fight against bank runs. We explore this question in this post, based on a recent working paper.
August 7, 2024
The Anatomy of Labor Demand Pre‑ and Post‑COVID

Has labor demand changed since the COVID-19 pandemic? In this post, we leverage detailed data on the universe of U.S. online job listings to study the dynamics of labor demand pre- and post-COVID. We find that there has been a significant shift in listings out of the central cities and into the “fringe” portion of large metro areas, smaller metro areas, and rural areas. We also find a substantial decline in job listings in computer and mathematical and business and financial operations occupations, and a corresponding increase in job openings in sales, office and administrative support, food preparation, and especially healthcare occupations. These patterns (by geography and by occupation) are interconnected: the biggest declines in job listings by occupation occurred in the largest and densest geographies, and the strongest increases in job listings by occupation occurred in the smaller and less populated geographies.
May 31, 2023
Do Economic Crises in Europe Affect the U.S.? Some Lessons from the Past Three Decades

In this post we summarize the main results of our contribution to a recent e-book, “The Making of the European Monetary Union: 30 years since the ERM crisis,” on the economic and financial crises in Europe since 1992-93, and focus on the spillovers of those crises onto the United States and the global economy. We find that the answer to the question in the title of this post is a (moderate) yes.
Posted at 7:00 am in Credit, Crisis, DSGE, Euro Area, Exchange Rates, Exports, International Economics, Macroeconomics | Permalink
May 24, 2023
Measuring the Financial Stability Real Interest Rate, r**

Comparing our financial stability real interest rate, r** (“r-double-star”) with the prevailing real interest rate gives a measure of how vulnerable the economy is to financial instability. In this post, we first explain how r** can be measured, and then discuss its evolution over the last fifty years and how to interpret the recent banking turmoil within this framework.
Posted at 7:00 am in Bank Capital, Banks, Crisis, Financial Markets, Monetary Policy | Permalink | Comments (2)
May 12, 2023
Banks Runs and Information

The collapse of Silicon Valley Bank (SVB) and Signature Bank (SB) has raised questions about the fragility of the banking system. One striking aspect of these bank failures is how the runs that preceded them reflect risks and trade-offs that bankers and regulators have grappled with for many years. In this post, we highlight how these banks, with their concentrated and uninsured deposit bases, look quite similar to the small rural banks of the 1930s, before the creation of deposit insurance. We argue that, as with those small banks in the early 1930s, managing the information around SVB and SB’s balance sheets is of first-order importance.
April 17, 2023
Financial Fragility without Banks

Proponents of narrow banking have argued that lender of last resort policies by central banks, along with deposit insurance and other government interventions in the money markets, are the primary causes of financial instability. However, as we show in this post, non-bank financial institutions (NBFIs) triggered a financial crisis in 1772 even though the financial system at that time had few banks and deposits were not insured. NBFIs profited from funding risky, longer-dated assets using cheap short-term wholesale funding and, when they eventually failed, authorities felt compelled to rescue the financial system.
 RSS Feed
 Follow Liberty Street Economics