


The term spread is the difference between interest rates on short- and long-dated government securities. It is often referred to as a predictor of the business cycle. In particular, inversions of the yield curve—a negative term spread—are considered an early warning sign. Such inversions typically receive a lot of attention in policy debates when they occur. In this post, we point to another property of the term spread, namely its predictive ability for financial crisis events, both internationally and in historical U.S. data. We study the predictive power of the term spread for financial instability events in the United States and internationally over the past 150 years.
The Term Spread as a Crisis Predictor
The behavior and slope of the yield curve are longstanding tools for predicting the onset of economic recessions within the next year, or future employment growth. Consideration of the yield curve as a predictor for recessions rose to prominence with Estrella and Mishkin’s (1996) paper. Rudebusch and Williams (2008) also highlighted the power of the term spread in predicting aggregate economic downturns. While there are many academic studies and other articles on the efficacy of the term spread and its inversion for predicting the onset of normal recessions, little is known about its forecasting performance for financial crises. Our study aims to close this gap.
In normal times, a bond with a longer maturity fetches a higher rate on the market due to increased duration risk. However, in the lead up to an economic downturn, various factors can alter the shape of the yield curve. Changes in risk attitudes and search for yield, central bank policy actions, and international demand for safe assets can all influence the term spread and drive the yield for short-term debt closer to or even above the yield for long-term debt. Are such changes in the term spread predictive of a higher risk of financial instability?
The Behavior of the Term Spread around Financial Crises
For our analysis, we use the Macrohistory Database compiled by Jordà, Schularick, and Taylor (2017). The data cover eighteen advanced economies around the world from 1870 to 2017 and contains country specific short- and long-term rates. For the United States specifically, these are the three-month Treasury bill and ten-year Treasury bond rates, respectively. The main benefit of the Macrohistory Database is that it enables examining financial crises in a variety of economic and temporal contexts. Our international sample consists of eight-three crises out of 2,304 total observations, or approximately four percent of the sample. The United States has six years marked as crisis years over the past 128 years: 1873, 1893, 1907, 1930, 1984, and 2007. A financial crisis is defined by Jordà, Schularick, and Taylor as a period of banking distress characterized by major bank failures, exceptional losses in the banking sector, and/or significant government intervention. Briefly, the 1873 and 1893 crises were bank runs precipitated by railroad failures, 1907 was brought on by the collapse of Knickerbocker Trust, 1984 marks the beginning of the Savings & Loan crisis, and 1930 and 2007 saw the Great Depression and Global Financial Crisis, respectively. We also corroborate our results using a different definition of financial instability, namely large declines in the market value of bank equity (Baron, Verner, and Xiong 2020).
The chart below plots the term spreads in the five years before and after a financial crisis or recession. We test, using regression analysis, whether the level of the term spread is above or below normal levels in these windows. The blue dots and bars in the chart represent point estimates and confidence intervals, respectively. They can be read as the average levels of the term spread in the lead-up to and aftermath of an event compared to periods where no event occurred. Positive values imply a higher level of the term spread than usual and negative values imply a lower level than usual.
The Term Spread before and after the Onset of Financial Crises and Recessions
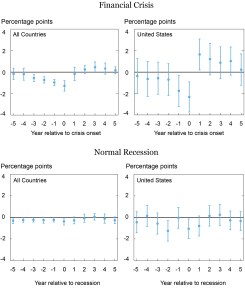
Source: Authors’ calculations based on data from the Macrohistory Database.
Notes: OLS coefficients for the crisis lag term are shown with 95 percent confidence intervals. Regressions including all countries use country fixed effects and standard errors are clustered at the country level.
It is clear that the term spread is significantly lower in the years before a financial crisis, both in the international sample and in the U.S. case. When all countries are considered, the term spread is approximately one percentage point lower on average in the two years before the onset of a crisis. For the United States specifically, this effect is almost doubled in the year before an onset, reaching 2 percentage points lower than usual on average. For a concrete example, in the run-up to 2007-08 financial crisis in the United States, long-term rates declined despite increasingly tight monetary policy, giving rise to Alan Greenspan’s famous description of the development as a “conundrum.” As a result, the term spread fell by 3 percentage points at the time. Similarly, though not as widely discussed contemporarily, the term spread declined a total of 3.3 percentage points in the United States between 1924 and 1928 in the lead-up to the 1929 crash and Great Depression. In the run-up to normal recessions, however, we observe only limited movement.
Using the Term Spread as a Forecasting Tool
With the knowledge that something abnormal occurs in the term spread in the years preceding a financial crisis, the natural next step is to examine its efficacy as a predictive tool and how it functions when used as part of a larger model including other known predictors of crises. Schularick and Taylor (2012) show that real bank-loan growth is a strong predictor of impending crisis and that model serves as the base for our later models. As for definitions of financial crises, we use both the Jordà-Schularick-Taylor narrative and the bank equity declines from Baron, Verner, and Xiong (2020).
We run logistic regressions to predict the two types of crises and compare models using real bank-loan growth and term spread as predictors. We also test the inclusion of an inverted yield curve (a negative term spread). The results are reported in the table below with each column reporting a separate regression.
The Term Spread as Predictor of Crises
| Crisis Type | Jordà-Schularick-Taylor | Baron‑Verner‑Xiong | ||||
|---|---|---|---|---|---|---|
| (1) | (2) | (3) | (4) | (5) | (6) | |
| Loan growth | 0.009*** | 0.010*** | 0.011*** | 0.010*** | 0.012*** | 0.013*** |
| (0.001) | (0.001) | (0.001) | (0.001) | (0.002) | (0.001) | |
| Term spread | -0.280*** | -0.339*** | ||||
| (0.058) | (0.092) | |||||
| Yield curve inverted | 0.876*** | 1.452*** | ||||
| (0.199) | (0.255) | |||||
| Area under curve | 0.62 | 0.69 | 0.67 | 0.61 | 0.73 | 0.72 |
| P-value | 0.02 | 0.10 | 0.00 | 0.02 | ||
| Observations | 1,704 | 1,704 | 1,704 | 1,629 | 1,629 | 1,629 |
Notes: Samples are truncated to have consistent observations across specifications. Logit regressions use country fixed effects and standard errors are clustered at the country level. *** indicates significance at the 1 percent level.
The crucial statistic for the performance of the model as a forecasting tool is the “area under curve,” which gives a metric for comparing the performance of classifiers in terms of the trade-off between false positives and true positives. It offers a test if the model performs better than a coin toss in predicting a crisis.
Our main finding is that, for both crisis definitions, including the term spread alongside standard predictors yields a significant improvement in forecasting power. A smaller term spread increases the risk of a financial crisis. Using the inverted yield curve as a predictor results in a slightly worse predictive ability of the model.
There are various possible explanations for the predictive ability that depend on whether the decrease of the term spread is driven by the short-term rate rising or the long-term rate falling. As seen in the panel chart below, when taken in isolation, rising short-term rates seem to play the dominant role for the narrowing of the term spread. This is because the long-term rate does not seem to behave differently in the run-up to a crisis. Such an increase in short-term funding rates relative to the yield on long-term investments is indicative of declining interest margins and higher risk taking by financial intermediaries. Our findings hence echo the evidence for rising financial risk taking in financial markets before financial crises that is reflected both in quantities of credit growth and a depressed price of risk (Krishnamurty and Muir 2017; Baron and Xiong 2017).
Rising Short-Term Rates Play Important Role for Term Spread Decline
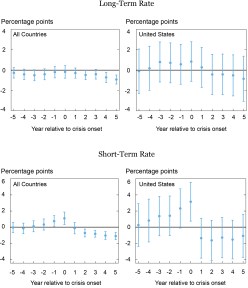
Source: Authors’ calculations based on data from the Macrohistory Database.
Notes: OLS coefficients for the crisis lag term are shown with 95 percent confidence intervals. Regressions including all countries use country fixed effects and standard errors are clustered at the country level.
Conclusion
The term spread is often used as an early warning indicator for recessions. In this post, we showed that it performs well as a predictor of financial crises, both internationally and in the United States alone. There is a significant benefit to including the term spread as a predictor for two separate crisis definitions. We identified that this effect is driven by the short end of the yield curve rising and offered a potential explanation based in higher risk taking by financial intermediaries in the time before a crisis.

Dean Parker is a senior research analyst in the Federal Reserve Bank of New York’s Research and Statistics Group.

Moritz Schularick is an assistant vice president in the Federal Reserve Bank of New York’s Research and Statistics Group.
Disclaimer
The views expressed in this post are those of the authors and do not necessarily reflect the position of the Federal Reserve Bank of New York or the Federal Reserve System. Any errors or omissions are the responsibility of the authors.
 RSS Feed
 Follow Liberty Street Economics