


11 posts from "July 2020"
July 17, 2020
MBS Market Dysfunctions in the Time of COVID‑19

Haoyang Liu, Asani Sarkar, and coauthors study a particular aspect of MBS market disruptions by showing how a long-standing relationship between cash and forward markets broke down, in spite of dealers increasing the provision of liquidity. The analysis also highlights an innovative response by the Federal Reserve that seemed to have helped to normalize market functioning.
Posted at 7:00 am in Financial Institutions, Financial Markets, Liquidity, Pandemic | Permalink | Comments (2)
July 16, 2020
Federal Reserve Agency CMBS Purchases

On March 23, the Open Market Trading Desk (the Desk) at the Federal Reserve Bank of New York initiated plans to purchase agency commercial mortgage-backed securities (agency CMBS) at the direction of the FOMC in order to support smooth market functioning of the markets for these securities. This post describes the deterioration in market conditions that led to agency CMBS purchases, how the Desk conducts these operations, and how market functioning has improved since the start of the purchase operations.
July 13, 2020
Delaying College During the Pandemic Can Be Costly

Many students are reconsidering their decision to go to college in the fall due to the coronavirus pandemic. Indeed, college enrollment is expected to be down sharply as a growing number of would-be college students consider taking a gap year. In part, this pullback reflects concerns about health and safety if colleges resume in-person classes, or missing out on the “college experience” if classes are held online. In addition, poor labor market prospects due to staggeringly high unemployment may be leading some to conclude that college is no longer worth it in this economic environment. In this post, we provide an economic perspective on going to college during the pandemic. Perhaps surprisingly, we find that the return to college actually increases, largely because the opportunity cost of attending school has declined. Furthermore, we show there are sizeable hidden costs to delaying college that erode the value of a college degree, even in the current economic environment. In fact, we estimate that taking a gap year reduces the return to college by a quarter and can cost tens of thousands of dollars in lost lifetime earnings.
July 8, 2020
Medicare and Financial Health across the United States
Consumer financial strain varies enormously across the United States. One pernicious source of financial strain is debt in collections—debt that is more than 120 days past due and that has been sold to a collections agency. In Massachusetts, the average person has less than $100 in collections debt, while in Texas, the average person has more than $300. In this post, we discuss our recent staff report that exploits the fact that virtually all Americans are universally covered by Medicare at 65 to show that health insurance not only improves financial health on average, but also is a major explanation for the heterogeneity in financial strain across the country. We find that Medicare affects different parts of the United States differently and plays a particularly important role in improving financial health in the least advantaged areas.
Do College Tuition Subsidies Boost Spending and Reduce Debt? Impacts by Income and Race
In an October post, we showed the effect of college tuition subsidies in the form of merit-based financial aid on educational and student debt outcomes, documenting a large decline in student debt for those eligible for merit aid. Additionally, we reported striking differences in these outcomes by demographics, as proxied by neighborhood race and income. In this follow-up post, we examine whether and how this effect passes through to other debt and consumption outcomes, namely those related to autos, homes, and credit cards. We find that access to merit aid leads to an immediate but temporary increase in eligible individuals’ consumption in these categories. The increase is followed by a decline in consumption and a reduction in total debt of these types in the longer term. Importantly, there are marked differences in these consumption and debt patterns across groups, as evident when we introduce proxies for demographic group using the income and racial composition of the students’ home neighborhoods of origin.
Measuring Racial Disparities in Higher Education and Student Debt Outcomes
Across the United States, the cost of all types of higher education has been rising faster than overall inflation for more than two decades. Despite rising costs, aggregate undergraduate enrollment rose steadily between 2000 and 2010 before leveling off and dipping slightly to its current level. Rising college costs have steadily increased dependence on student debt for college financing, with many students and parents turning to federal and private loans to pay for higher education. An earlier post in this series reported that borrowers in majority Black areas have higher student loan balances and rates of default than those in both majority white and majority Hispanic areas. In this post, we study how differences in college attendance rates and in the types of colleges attended generate heterogeneity in loan experiences. Specifically, using nationwide data, we analyze heterogeneities in college-going and heterogeneities in student debt and default experiences by college type across individuals living in majority Black, majority Hispanic, and majority white zip codes.
Posted at 7:30 am in Education, Equitable Growth, Household Finance, Inequality, Student Loans | Permalink
Who Has Been Evicted and Why?
More than two million American households are at risk of eviction every year. Evictions have been found to cause prolonged homelessness, worsened health conditions, and lack of credit access. During the COVID-19 outbreak, governments at all levels implemented eviction moratoriums to keep renters in their homes. As these moratoriums and enhanced income supports for unemployed workers come to an end, the possibility of a wave of evictions in the second half of the year is drawing increased attention. Despite the importance of evictions and related policies, very few economic studies have been done on this topic. With the exception of the Milwaukee Area Renters Study, evictions are rarely measured in economic surveys. To fill this gap, we conducted a novel national survey on evictions within the Housing Module of the Survey of Consumer Expectations (SCE) in 2019 and 2020. This post describes our findings.
Inequality in U.S. Homeownership Rates by Race and Ethnicity
Homeownership has historically been an important means for Americans to accumulate wealth—in fact, at more than $15 trillion, housing equity accounts for 16 percent of total U.S. household wealth. Consequently, the U.S. homeownership cycle has triggered large swings in Americans’ net worth over the past twenty-five years. However, the nature of those swings has varied significantly by race and ethnicity, with different demographic groups tracing distinct trajectories through the housing boom, the foreclosure crisis, and the subsequent recovery. Here, we look into the dynamics underlying these divergences and explore some potential explanations.
July 7, 2020
Introduction to Heterogeneity Series III: Credit Market Outcomes
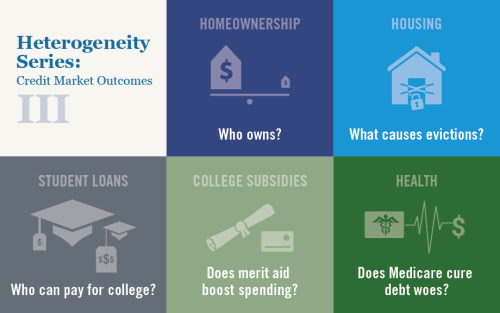
Following up series on heterogeneity and inequality broadly and in labor market outcomes specifically, we turn our focus to further documenting heterogeneity in credit market outcomes, looking at disparities in home ownership rates, varying exposure to evictions, differing gains from tuition support and Medicare programs, and more.
A New Reserves Regime? COVID‑19 and the Federal Reserve Balance Sheet
Aggregate reserves declined from nearly $3 trillion in August 2014 to $1.4 trillion in mid-September 2019, as the Federal Reserve normalized its balance sheet. This decline came to a halt in September 2019 when the Federal Reserve responded to turmoil in short-term money markets, with reserves fluctuating around $1.6 trillion in the early months of 2020. Then, in response to the COVID-19 pandemic, the Federal Reserve dramatically expanded its balance sheet, both directly, through outright purchases and repurchase agreements, and indirectly, as a consequence of the facilities to support market functioning and the flow of credit to the real economy. In this post, we characterize the increase in reserves between March and June 2020, describing changes to the distribution and concentration of reserves.
Posted at 7:00 am in Fed Funds, Federal Reserve, Fiscal Policy, Liquidity, Monetary Policy, Pandemic | Permalink
 RSS Feed
 Follow Liberty Street Economics