










170 posts on "International Economics"
October 6, 2026
How Fast Do Tariffs Pass Through into Consumer Prices?

There has been a lot of interest in how tariffs affect consumer prices (for example, Cavallo et al. 2021, 2025). In this post, we present results from our new research paper that estimates the effects of the 2025-26 tariffs on retail consumer prices. We find that for every percentage point increase in average tariffs, consumer goods prices increase by about a quarter of a percent after one year. Roughly two-thirds of the effect arises because tariffs raise the prices of imported consumer goods. The remaining third arises indirectly: tariffs increase the prices of goods made in the U.S. because producers pay more for imported parts and materials, and because producers raise their markups when competing imports cost more. The effects differ in their timing. Prices of imported goods respond quickly to tariffs, while prices of U.S.-made goods adjust over six to twelve months as higher costs move through the supply chain.
October 1, 2026
Navigating Geoeconomic Risk in the U.S. Stock Market

Geoeconomic risk—the risk that firms incur valuation losses when countries deploy economic, trade, or financial leverage for geopolitical aims—has become a first-order concern for investors. In this post, based on our recent Staff Report, we document that domestic U.S. stocks expose investors to substantial geoeconomic risk through firms’ global supply-chain relationships, affecting investors’ returns and portfolio allocation. We also find that investors are compensated for bearing geoeconomic risk through higher risk premia.
September 2, 2026
Are Central Banks Moving Out of Dollar Assets?
The dollar’s share of global official foreign exchange reserves fell from 64 percent in 2015 to 56 percent in 2025. This downward trajectory is sometimes read as evidence that the dollar’s role in international financial markets is eroding. However, aggregate statistics obscure the composition of changes occurring at the country level. In this post, we show that the aggregate decline is not a systematic global shift away from dollar assets. Rather, the aggregate decline reflects the actions of a handful of large reserve holders, changing either their currency preferences or the size of their reserve portfolio. From the perspective of the cross section of countries holding dollar assets, the dollar’s status in official portfolios is largely intact.
June 26, 2026
How Resilient Were Emerging Market Economies Through the 2022‑23 U.S. Monetary Tightening Cycle?

The cross-border spillover effects of shifts in U.S. monetary policy have long been a focus of academics and policymakers alike. A common finding in the literature is that changes in the stance of U.S. monetary policy have sizable effects on economic activity and financial markets in emerging market economies (EMEs). In this post, we analyze one specific aspect of these spillovers: how EMEs fared through the U.S. monetary policy tightening cycle of 2022-23 relative to the predictions of a model, which was calibrated to capture empirically relevant features of these economies based on historical data. We find that more vulnerable EMEs fared better in both financial market and growth outcomes than would be expected from our model, while the relatively less vulnerable fared a bit better than the model predictions for financial outcomes but substantially worse for growth outcomes.
May 18, 2026
Honey, Who Shrunk the U.S. Income Surplus?

Foreign holdings of U.S. financial assets are immense, with official estimates putting their current market value at $69 trillion. U.S. holdings of foreign assets are also impressive but much smaller, at $41 trillion. The shortfall in U.S. foreign assets relative to foreign liabilities has been mounting for decades. Yet U.S. investment income receipts—in profits, dividends, and interest—comfortably exceeded income payments until recently. We show that the fading of the net investment income surplus stems from the upward shift in interest rates in the aftermath of the pandemic along with the continued net sales of U.S. assets to foreign investors.
May 11, 2026
Will Mounting Supply Chain Strains Hamstring the AI Investment Boom?

The conflict in the Middle East has precipitated a global supply shock—the third in six years following the pandemic in 2020 and Russia’s invasion of Ukraine in 2022. The current shock raises the specter of spillovers to the U.S. through both prices and physical shortages of goods. A critical conduit for spillovers through these channels is via Asian supply chains, especially from middle- to lower-middle income countries in southeast Asia, which are key suppliers for goods needed for the AI infrastructure build-out in the U.S. These countries are also heavily reliant on Middle East energy imports. This post examines key factors related to these Asian supply chain vulnerabilities.
Posted at 7:00 am in Artificial Intelligence (AI), International Economics, Supply Chain | Permalink
May 4, 2026
In What Ways Has U.S. Trade with China Changed?
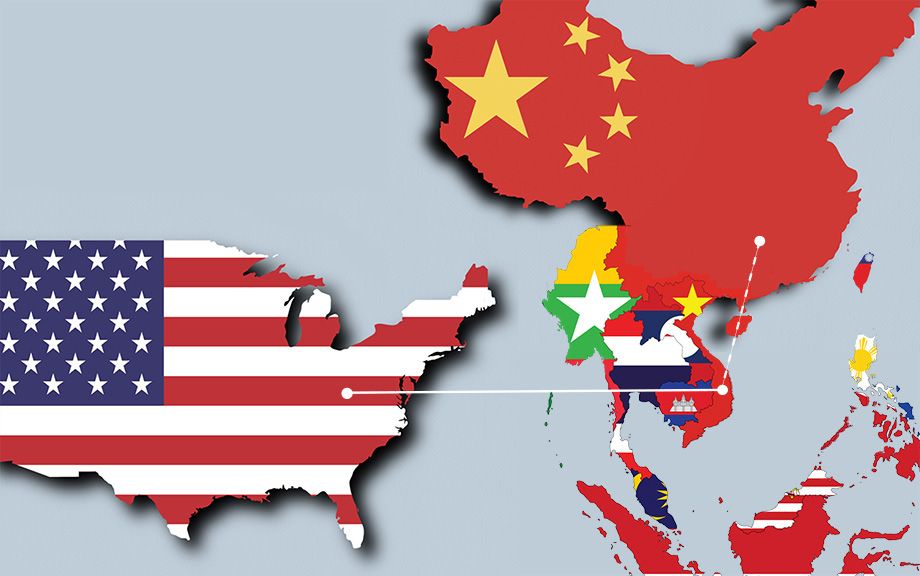
Over the past year, U.S. trade policy with China has undergone enormous changes, but with surprisingly little effect on overall trade balances. In fact, the U.S.’s twelve-month trade deficit, while highly volatile due to import front-running early in the year, ended 2025 at $1.2 trillion, almost unchanged from 2024. At the same time, China’s trade surplus with the world actually increased from $1 trillion to $1.2 trillion. However, when looking at changes between individual countries, one sees large shifts in bilateral balances. In this post, we will focus on changing trade flows between the U.S., China, and southeast Asia.
Posted at 7:00 am in Artificial Intelligence (AI), International Economics, Tariffs | Permalink | Comments (2)
April 9, 2026
A Closer Look at Emerging Market Resilience During Recent Shocks

A succession of shocks to the global economy in recent years has focused attention on the improved economic and financial resilience of emerging market economies. For some of these economies, this assessment is well-founded and highlights the fruits of deep, structural economic reforms since the 1990s. However, for a much larger universe of countries, the ability to weather shocks is still mixed and many remain vulnerable. In this post, we explore the divide between the two sets of countries and focus on the effects of recent economic shocks, including the ongoing conflict in the Middle East.
Posted at 7:00 am in International Economics | Permalink
March 23, 2026
China’s Electric Trade

China has spent considerable government resources to develop advanced electric technology industries, such as those that produce electric vehicles, lithium batteries, and solar panels. These efforts have spilled over to international trade as improvements in price and quality have increased the global demand for these goods. One consequence is that passenger cars and batteries have been disproportionately large contributors to the rise in the country’s trade surplus in recent years. This has not been the case, though, for solar panels, as falling prices due to a supply glut pulled down export revenues despite higher volumes.
February 12, 2026
Who Is Paying for the 2025 U.S. Tariffs?

Over the course of 2025, the average tariff rate on U.S. imports increased from 2.6 to 13 percent. In this blog post, we ask how much of the tariffs were paid by the U.S., using import data through November 2025. We find that nearly 90 percent of the tariffs’ economic burden fell on U.S. firms and consumers.
 RSS Feed
 Follow Liberty Street Economics
