


Our previous post identified strong global components in the slow-moving and persistent dynamics of headline consumer price index (CPI) inflation in the U.S. and abroad. We labeled these global components as the Global Inflation Trend (GIT), the Core Goods Global Inflation Trend (CG-GIT) and the Food & Energy Global Inflation Trend (FE-GIT). In this post we offer a narrative of the drivers of these global inflation trends in terms of shocks that induce a trade-off for monetary policy, versus those that do not. We show that most of the surge in the persistent component of inflation across countries is accounted for by global supply shocks—that is, shocks that induce a trade-off for central banks between their objectives of output and inflation stabilization. Global demand shocks have become more prevalent since 2022. However, had central banks tried to fully offset the inflationary pressures due to sustained demand, this would have resulted in a much more severe global economic contraction.
Drivers of Global Inflation Trends: Supply and Demand Shocks
The source of global inflation trends can be traced to alternative and non-mutually exclusive factors. The common trends may be the result of correlated or global shocks: the COVID-19 pandemic, or the synchronized tightening of monetary policy in response to the generalized rise in inflation would be such examples. At the same time, common trends may be due to spillovers from shocks that originate in countries that have a large global footprint, either because of their dominant role in the international financial system, or because of their dominant role in driving international trade flows within global supply chains, or both. The financial crisis of 2008 could be an example of the latter. In our previous post, we abstracted from the ultimate determinants and thought of the estimated trends as merely a reduced-form tool to summarize the degree of common variation across inflation rates.
In this post, we go a step further and try to disentangle those determinants, distinguishing shocks that induce a trade-off for monetary policy, versus those that do not, over the post-pandemic sample. Trade-off inducing shocks make prices and output move in opposite directions, thus creating a scenario where central banks must choose between keeping inflation stable at the cost of large swings in output, and vice versa. This is the case of supply shocks. Conversely, shocks that lead to prices and output moving in the same direction, and therefore do not induce such trade-off, are more easily accommodated by monetary policy. This is because monetary policy, too, operates via the demand side of the economy.
For this exercise we adopt a structural vector autoregression (VAR) approach, where we combine our estimated global inflation trends with indicators of global economic activity and the New York Fed’s Global Supply Chain Pressure Index (GSCPI). To disentangle demand and supply factors in the post-pandemic period we exploit the co-movement among the model’s variables: we assume that adverse supply shocks put pressure on global supply chains and on inflation but decrease global output. Conversely, adverse demand shocks drag down both output and inflation, and release pressure on global supply chains, in accordance with our earlier characterization of these two main drivers.
The panel chart below reports the decomposition of the three variables in the VAR in terms of the identified shocks since January 2020, and in deviation from the model’s forecast as of December 2019 (the dashed line). The model’s forecast represents a useful benchmark as it tracks the evolution of the variables absent any shocks. The bulk of the variation in the GIT (the far right panel) is accounted for by global supply shocks—which in our definition encompass both energy and non-energy supply shocks—until the beginning of 2023. On the other hand, depressed global demand pushed down the GIT in 2020 but has been a relatively minor contributor from 2021 to 2023. Since then, strong global demand can fully account for the sideways movements in the GIT. Our simple decomposition implies that the stall in inflation deceleration in the U.S. and abroad since mid-2023 is due to too strong global demand—that is, to shocks that monetary policy can potentially fully offset.
Supply Shocks Drove the Global Inflation Trend Up During the Post-Pandemic Surge
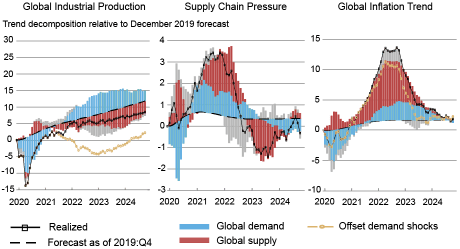
Notes: In each subplot, the line with markers denotes actual realizations in deviation from 2019:12. The dashed line is the VAR-based forecast as of 2019:12. The bars show the contribution of the identified shocks. Gray bars are for unlabeled shocks. VAR estimation sample 1997:10-2024:10. We thank Giorgio Primiceri for sharing the code to produce the figure.
An interesting question is therefore what would have happened if central banks had responded forcefully enough to fully offset the contribution of demand shocks that emerged since mid-2021. The answer to this counterfactual question is the gold line in the panels above. The counterfactual shows that under this scenario, the path for global output would have been perceptively and persistently lower, with endpoint shortfall more than twice the size of where it sits now relative to the forecast, and much more severe in 2022 and 2023. However, the gain in terms of inflation reduction would have been rather modest.
In the next chart, we perform the same decomposition for the international trends in the tradable goods sectors. The top panels in the chart use the same definition of supply and demand shocks used above. The bottom two panels further decompose supply shocks into energy and non-energy supply shocks.
Supply Shocks Drove Inflation Up During the Post-Pandemic Surge
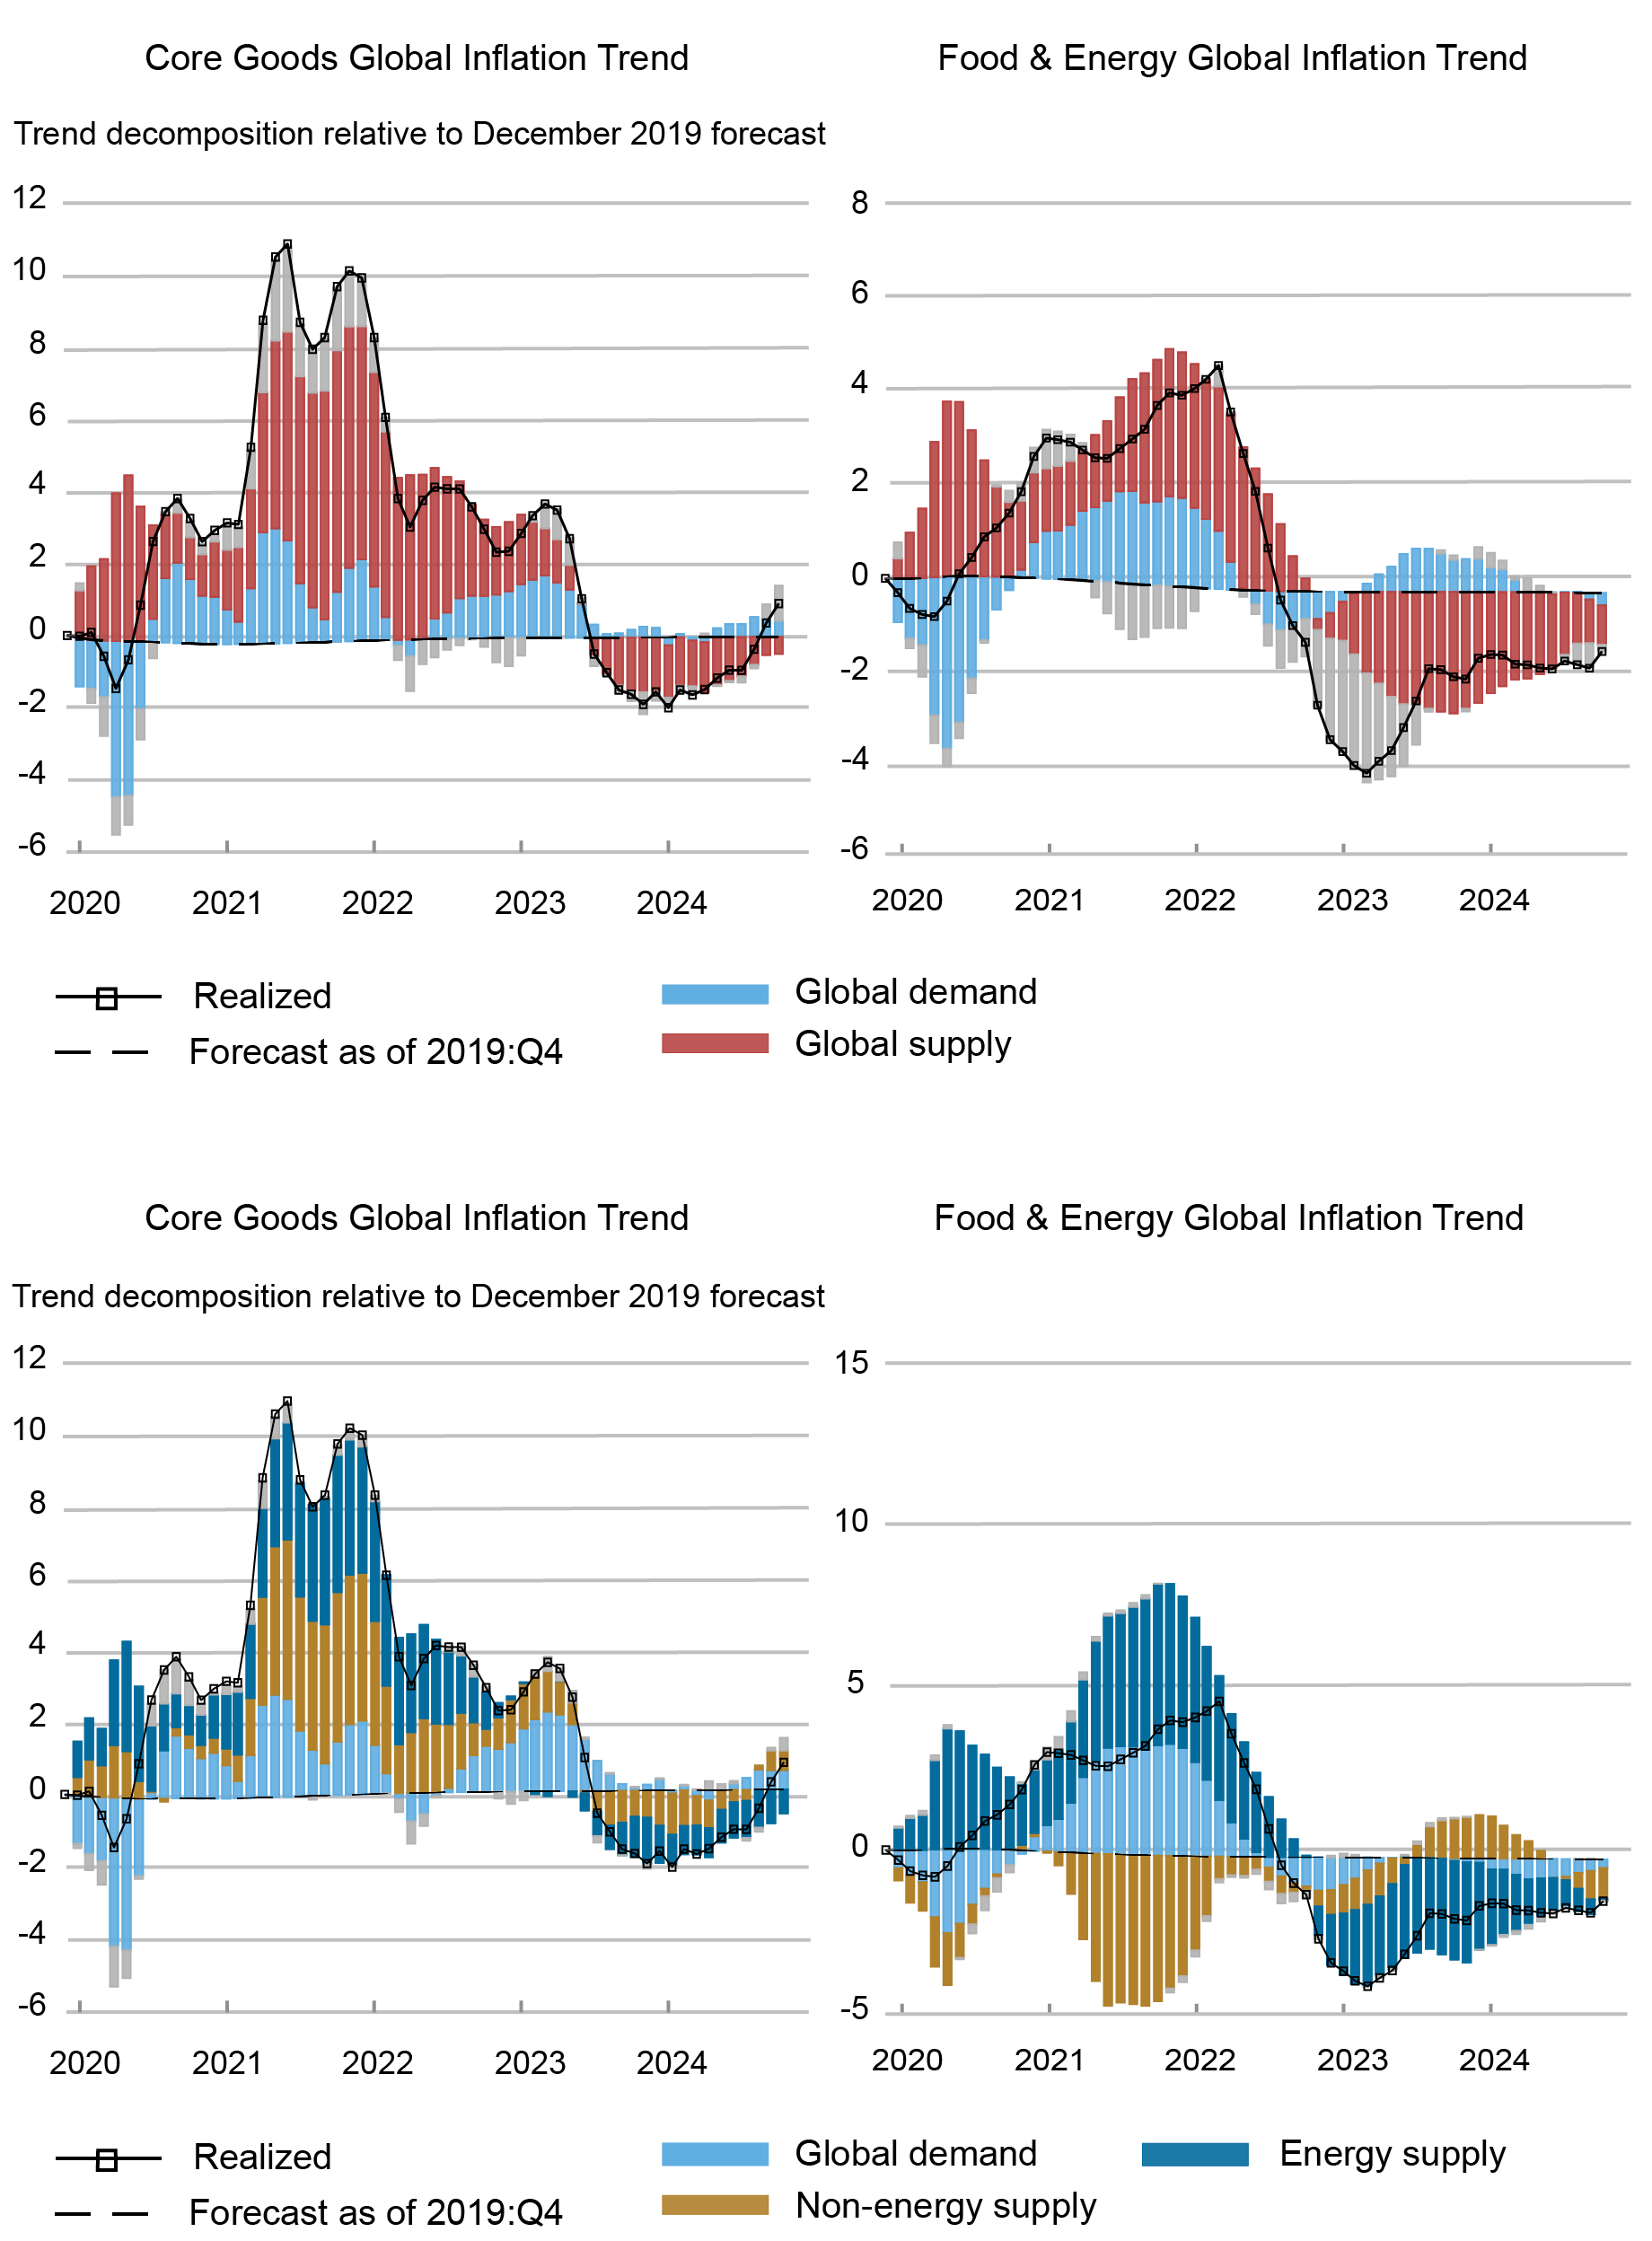
Notes: In each subplot, the line with markers denotes actual realizations in deviation from 2019:12. The dashed line is the VAR-based forecast as of 2019:12. The bars show the contribution of the identified shocks. Gray bars are for unlabeled shocks. VAR estimation sample 1997:10-2024:10. Non-energy supply shocks impose a core goods inflation/output trade-off and raise global supply chain pressures. Energy prices in this case co-move positively with global output. Conversely, energy shocks impose a trade-off between global output and both inflation trends.
The charts show that supply shocks have been the major contributing factor also for the evolution of core goods and food & energy global inflation trends. Looking at core goods (upper left panel), global demand is responsible for the small 2020 drag in its global trend (CG-GIT). The contribution of global demand turns positive thereafter, but it is decisively second-order relative to the effects of global supply shocks that are responsible for both the steep increase in 2021 and the subsequent sharp decline in early 2022. Favorable supply conditions also account for the decline across 2023-24. However, it is a nascent pickup in global demand that seems to be pushing this trend up in the latest months of 2024. Turning to the charts in the bottom row, energy and non-energy supply shocks contribute roughly in equal measure to the core goods trend, and always in the same direction (left panel). The account is slightly different for the global trend in food & energy inflation (FE-GIT). Here energy and non-energy shocks push inflation in opposite directions until the end of 2022, when energy shocks finally ease and markedly push down the global trend.
Conclusion
To summarize, our analysis highlights that most of the movements we saw in the global factors since the onset of the pandemic were due to adverse changes to supply conditions. These shocks imply a stark trade-off for monetary policy since maintaining price stability is costly in terms of economic activity. Since mid-2023, however, the disinflation has stalled because of elevated global demand. While no trade-off is present in this case, the unprecedented adverse supply shocks that have hit most economies since the pandemic mean that even if central banks had committed to fully offset demand shocks, they would have achieved a relatively modest reduction in global inflation, but at the cost of a very large contraction in global growth.

Ozge Akinci is head of International Studies in the Federal Reserve Bank of New York’s Research and Statistics Group.

Martín Almuzara is a research economist in the Federal Reserve Bank of New York’s Research and Statistics Group.

Silvia Miranda-Agrippino is a research economist in the Federal Reserve Bank of New York’s Research and Statistics Group.

Ramya Nallamotu is a research analyst in Macroeconomic and Monetary Studies in the Federal Reserve Bank of New York’s Research and Statistics Group.

Argia Sbordone is head of Macroeconomic and Monetary Studies in the Federal Reserve Bank of New York’s Research and Statistics Group.

Greg Simitian is a research analyst in International Studies in the Federal Reserve Bank of New York’s Research and Statistics Group.

William Zeng is a research analyst in International Studies in the Federal Reserve Bank of New York’s Research and Statistics Group.
How to cite this post:
Ozge Akinci, Martin Almuzara, Silvia Miranda-Agrippino, Ramya Nallamotu, Argia Sbordone, Greg Simitian, and William Zeng, “Supply and Demand Drivers of Global Inflation Trends,” Federal Reserve Bank of New York Liberty Street Economics, February 27, 2025, https://libertystreeteconomics.newyorkfed.org/2025/02/supply-and-demand-drivers-of-global-inflation-trends/
BibTeX: View |

Disclaimer
The views expressed in this post are those of the author(s) and do not necessarily reflect the position of the Federal Reserve Bank of New York or the Federal Reserve System. Any errors or omissions are the responsibility of the author(s).
 RSS Feed
 Follow Liberty Street Economics