


This post discusses the evolution of the short-run natural rate of interest, or short-run r*, over the past year and a half according to the New York Fed DSGE model, and the implications of this evolution for inflation and output projections. We show that, from the model’s perspective, short-run r* has increased notably over the past year, to some extent outpacing the large increase in the policy rate. One implication of these findings is that the drag on the economy from recent monetary policy tightening may have been limited, rationalizing why economic conditions have remained relatively buoyant so far despite the elevated level of interest rates.
The Policy Stance according to the DSGE Model
In the chart below, the top row of panels show the expected paths of two variables: (1) the federal funds rate (FFR), as informed by projections from the Survey of Primary Dealers for the first six quarters following the start of the projection and the model’s policy rule thereafter (see this document for more details on the model); and (2) nominal short-run r*, defined as the real natural rate of interest plus inflation expectations according to the model (while yesterday’s post focused on real measures of r*, here we plot nominal r* so that it can be compared with the FFR). These objects are shown for three forecast dates: December 2021, when the FOMC had just begun to consider policy tightening; June 2022, after tightening had started; and March 2023. As always, we should remind readers that any projection shown here, including the FFR and r* projections, are not by any stretch of the imagination official forecasts of the New York Fed’s research staff and only reflect the output of one of the many models that the staff uses.
The Evolution of Monetary Policy and Short-Run Nominal r* according to the New York Fed DSGE Model
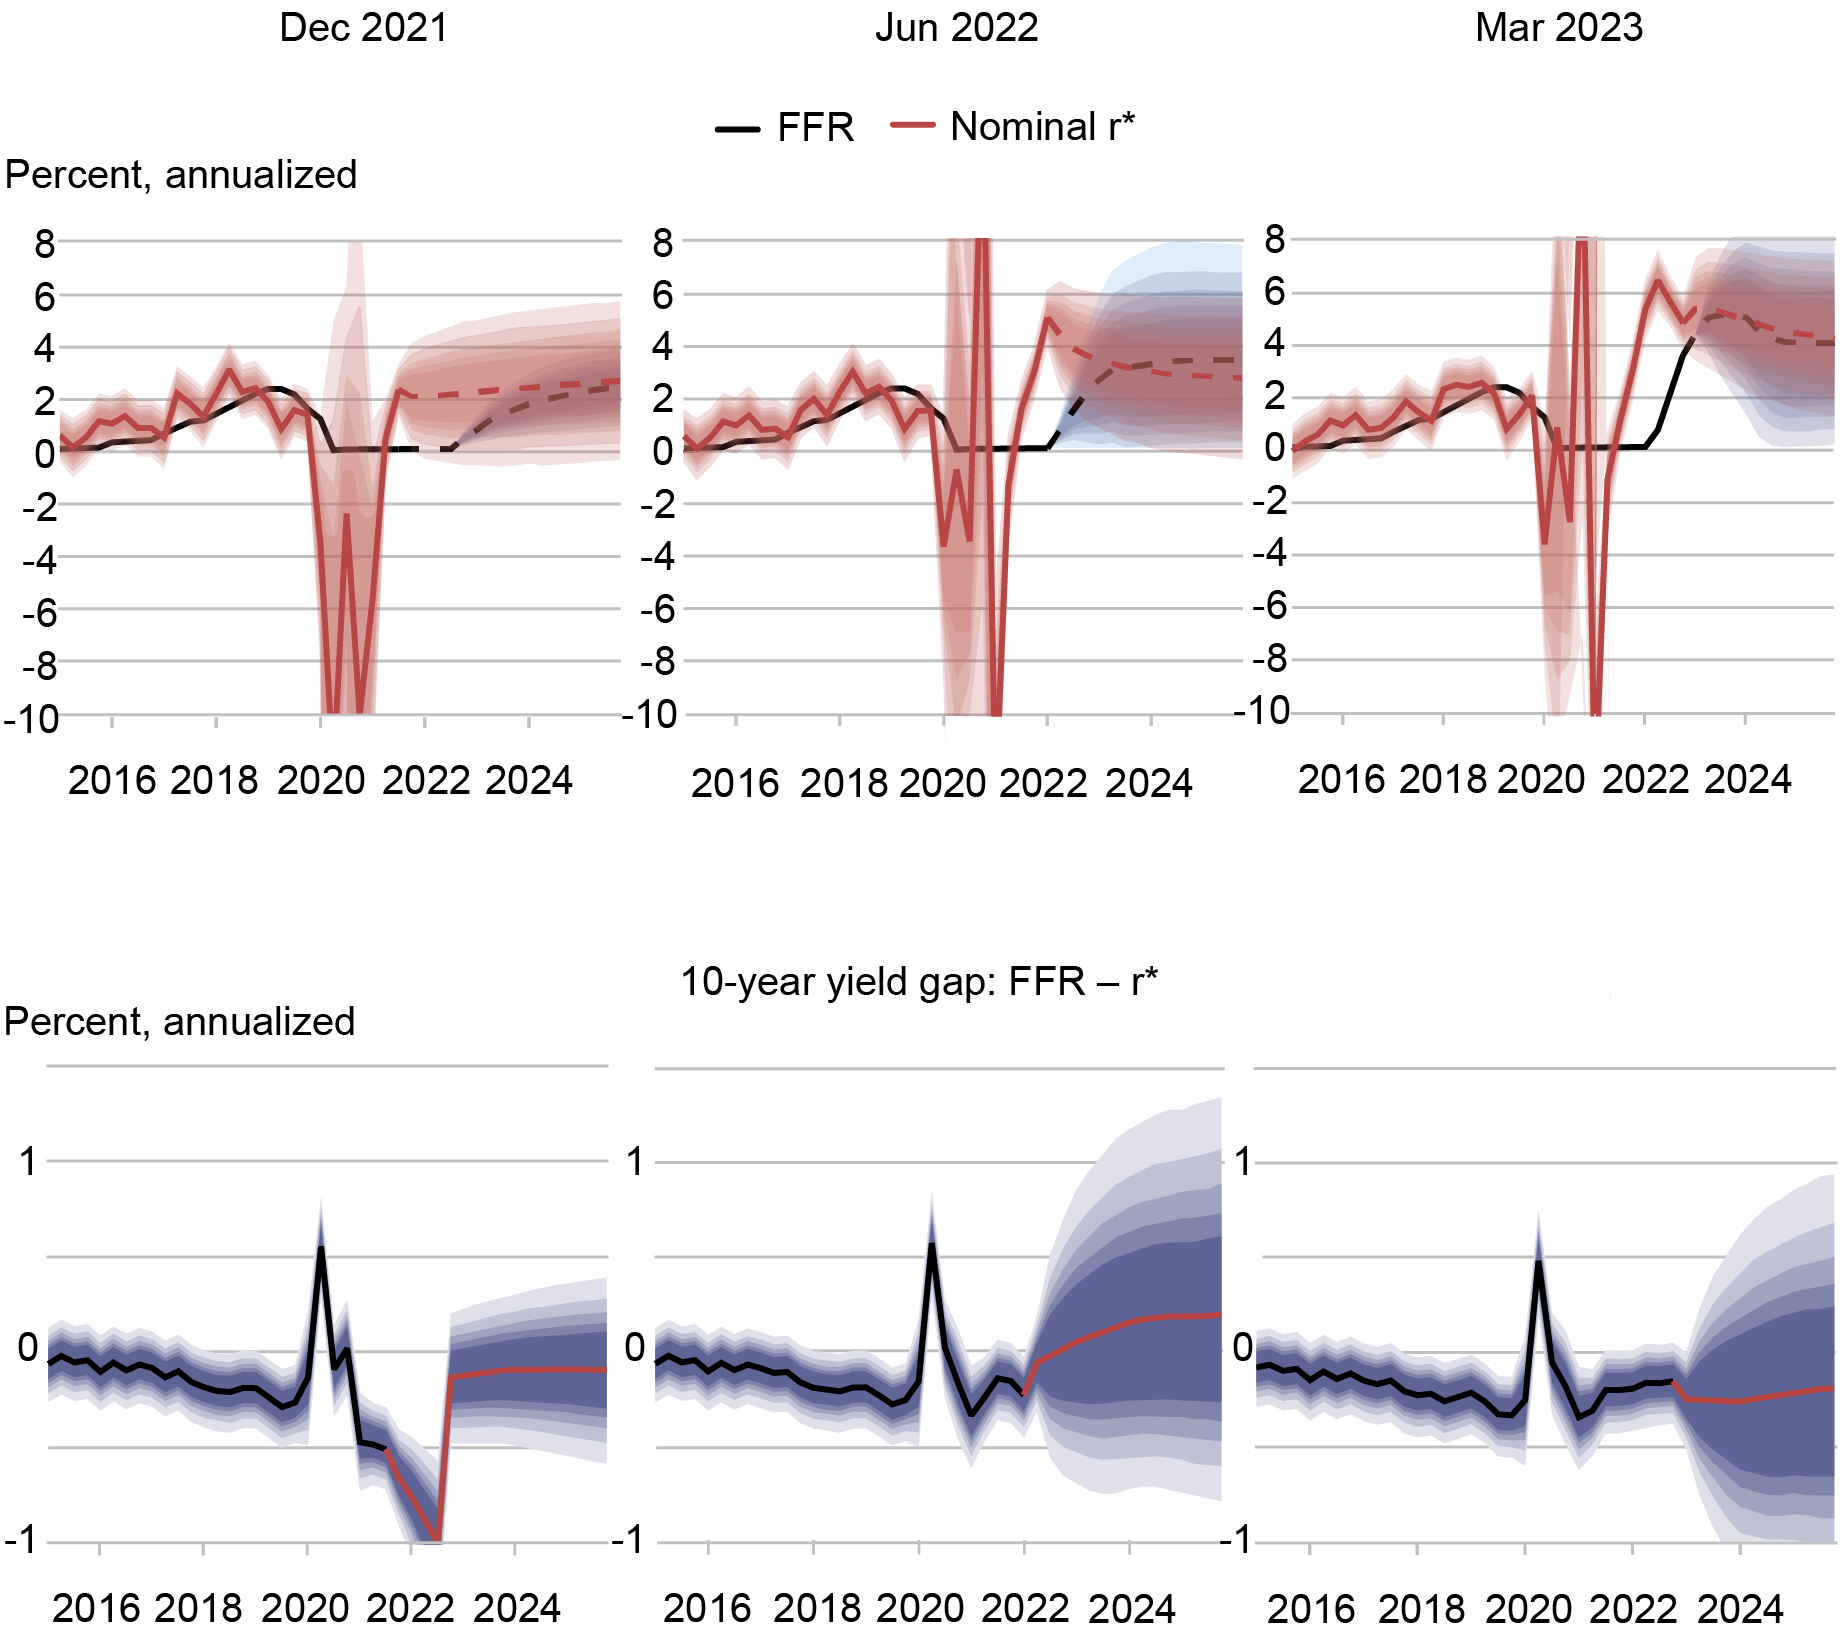
Notes: In the top row of panels, dashed lines show model forecasts. In the bottom row of panels, red lines show the model forecasts. The shaded areas mark the uncertainty associated with our forecasts at 50, 60, 70, 80, and 90 percent probability intervals.
The bottom row of panels show the difference in the ten-year risk-neutral yield (that is, the average expected FFR over the next ten years) and the average expected short-run r*’s over the same period, both computed using the model. According to the standard dynamic investment-saving (IS) curve describing demand in New Keynesian DSGE models, this difference is what determines whether policy is restrictive (when the difference is positive, meaning that on average the FFR is expected to be above nominal r* over the foreseeable future) or accommodative (negative). This is because this difference maps onto the output gap, at least in simple models: when policy is accommodative the gap is positive—output is above natural output—and vice versa (see, for instance, the discussion in this paper on the so-called “forward guidance puzzle”).
According to the model, in December 2021 policy was clearly very accommodative: the FFR was well below r* and expected to remain so. By June 2022, policy had reversed course quite dramatically: the June level of the FFR was still below r*, but was expected to be above it soon and to remain so for a considerable period. By March 2023, the policy path had increased further, but the path for r* had increased even more, so that policy is no longer as restrictive as it was in June, at least in the model’s eyes. Financial conditions shocks are the key driver of the increase in r*, and of the persistence of inflation, as we’ll see next. Before we delve into the drivers of the increase in r*, we should stress that this model-based assessment is subject to great uncertainty, as shown by the shaded blue areas: the model itself is not quite sure of its conclusions on what the stance of current, and especially future, policy is. Additionally, the reader should again consider that this is just one model, and a mis-specified one at that—like most, if not all, DSGE models.
Drivers of Short-Run r*, and Implications for the Inflation and Output Forecasts
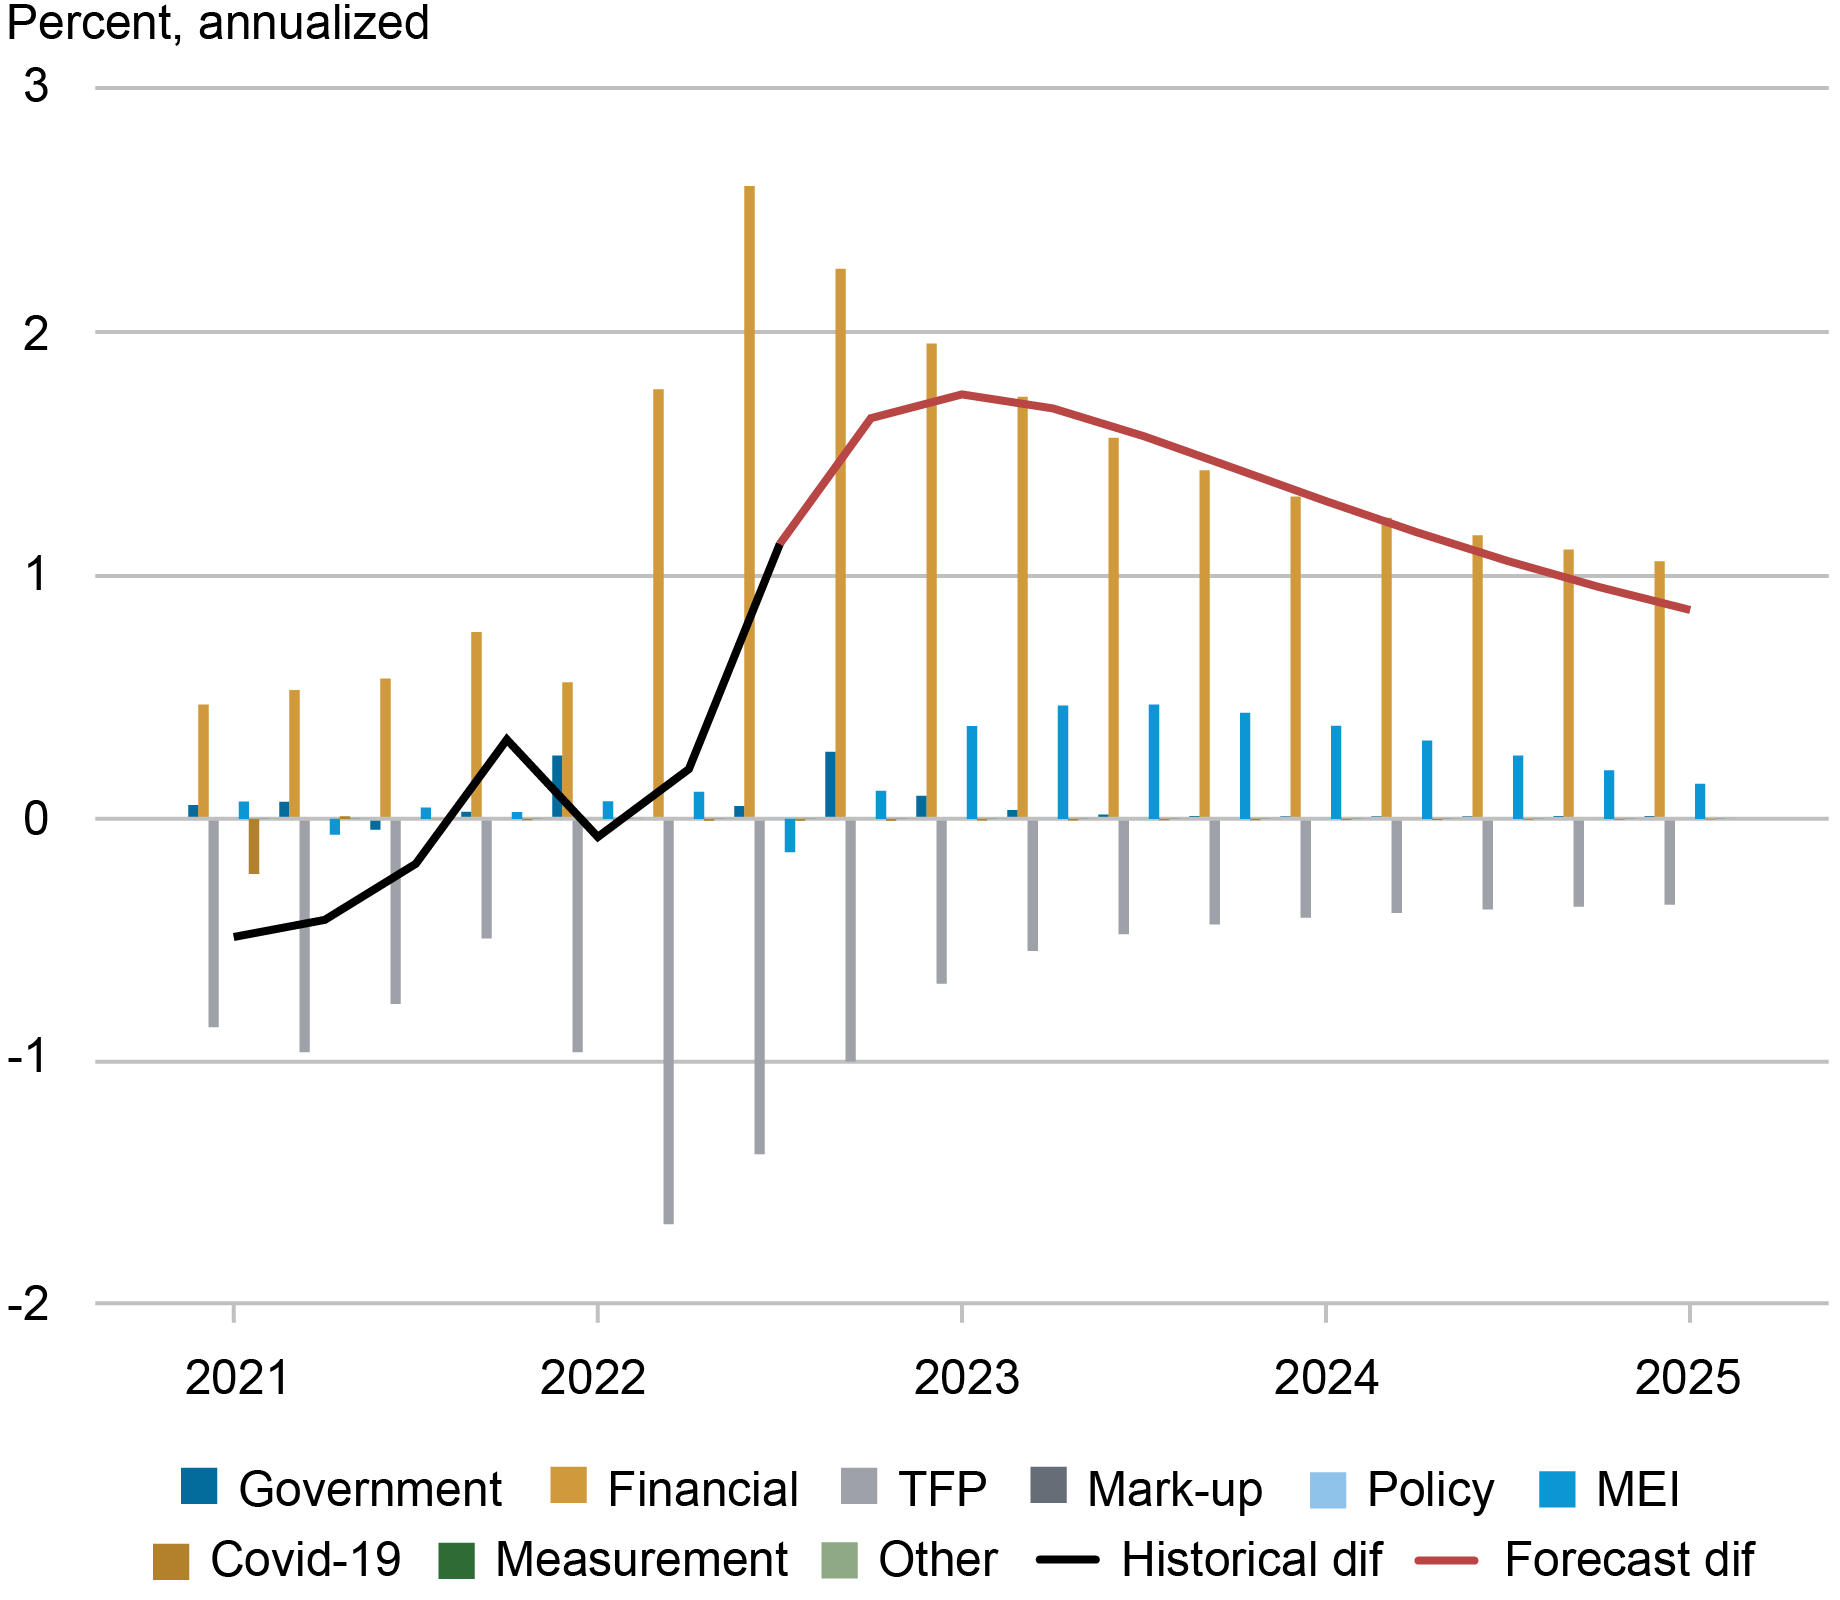
The chart below decomposes the change in real r* (black line) and its forecast (red line) between June 2022 and March 2023 (note that these are changes in the real variable, as opposed to the nominal r* shown in the previous picture). The chart shows that “financial’’ shocks (purple) are the key driver of this change. These shocks capture the fact that financial conditions, as measured for instance by corporate spreads, have remained very resilient in spite of the increase in the policy rate (and of the recent banking turmoil).
Change in r* and Its Drivers according to the Model
The changed assessment of the natural rate of interest has implications for the model’s prediction for both real activity and inflation, which we have been documenting in our DSGE model forecast posts (here is the latest one from June). The model’s inflation projections, which we report below, indicate that inflation’s persistence has increased notably between December 2021, when inflation was expected to revert rapidly to the FOMC’s long run goal of 2 percent (in other words, the model then largely embraced the infamous “transitory” view of inflation), and March of this year, when inflation was projected to return only gradually toward the FOMC’s objective. The same shocks pushing r* up also drive up the inflation projections. Of course, these shocks also affect the output forecasts, which are now much less pessimistic than they were in June of last year, when the model placed substantial probability on the event of a recession.
Evolution of the Core PCE Inflation Forecasts in the DSGE Model
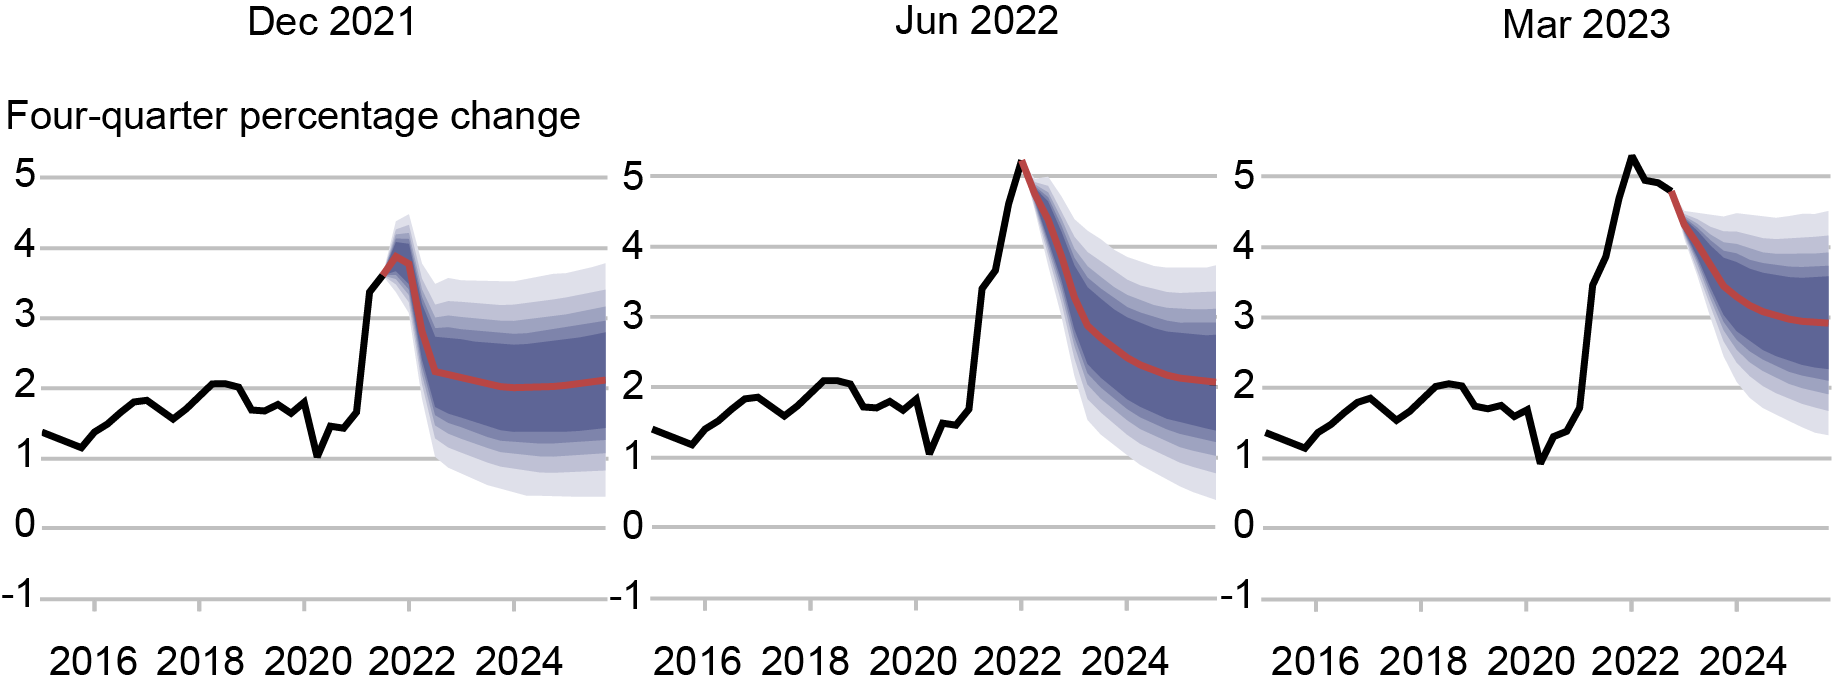
Notes: In each panel, the black line indicates actual data and the red line shows the model forecasts. The shaded areas mark the uncertainty associated with our forecasts at 50, 60, 70, 80, and 90 percent probability intervals.
In sum, to make sense of recent developments in the U.S. economy, we must explain the fact that the economy remains quite strong in spite of the FFR being more than 500 basis points higher than it was a little more than a year ago. The model rationalizes these developments by postulating that the short-run natural rate of interest has increased considerably over the past year. This, in turn, has implications for the speed of the decline of inflation toward the FOMC’s long run goal and for assessing the stance of monetary policy.
Katie Baker is a former research analyst in the Federal Reserve Bank of New York’s Research and Statistics Group.

Logan Casey is a research analyst in the Federal Reserve Bank of New York’s Research and Statistics Group.

Marco Del Negro is an economic research advisor in Macroeconomic and Monetary Studies in the Federal Reserve Bank of New York’s Research and Statistics Group.
Aidan Gleich is a former research analyst in the Federal Reserve Bank of New York’s Research and Statistics Group.

Ramya Nallamotu is a research analyst in the Federal Reserve Bank of New York’s Research and Statistics Group.
How to cite this post:
Katie Baker, Logan Casey, Marco Del Negro, Aidan Gleich, and Ramya Nallamotu, “The Evolution of Short‑Run r* after the Pandemic,” Federal Reserve Bank of New York Liberty Street Economics, August 10, 2023, https://libertystreeteconomics.newyorkfed.org/2023/08/the-evolution-of-short-run-r-after-the-pandemic/
BibTeX: View |


Disclaimer
The views expressed in this post are those of the author(s) and do not necessarily reflect the position of the Federal Reserve Bank of New York or the Federal Reserve System. Any errors or omissions are the responsibility of the author(s).
 RSS Feed
 Follow Liberty Street Economics