


This post presents an update of the economic forecasts generated by the Federal Reserve Bank of New York’s dynamic stochastic general equilibrium (DSGE) model. We describe very briefly our forecast and its change since December 2022. Note that this forecast was produced on February 27, and hence should be viewed as reflecting the state of the economy before the current banking sector turmoil.
As usual, we wish to remind our readers that the DSGE model forecast is not an official New York Fed forecast, but only an input to the Research staff’s overall forecasting process. For more information about the model and variables discussed here, see our DSGE model Q & A.
The New York Fed model forecasts use data released through 2022:Q4, augmented for 2023:Q1 with the median forecasts for real GDP growth and core PCE inflation from the February release of the Philadelphia Fed Survey of Professional Forecasters (SPF), as well as the yields on 10-year Treasury securities and Baa-rated corporate bonds based on 2022:Q4 averages up to February 27. Moreover, starting in 2021:Q4, the expected federal funds rate between one and six quarters into the future is restricted to equal the corresponding median point forecast from the latest available Survey of Primary Dealers (SPD) in the corresponding quarter. For the current projection, this is the January/February SPD.
A key challenge in making sense of recent developments in the U.S. economy, at least before the current financial turmoil, centered on explaining the evolution of inflation (the fact that it has started to decline relative to its peak in 2022), together with the fact that the economy remained at least as strong as it was a year ago, if not stronger—despite a 450 basis point increase in the fed funds rate over that time. The model explained these developments by postulating that: (1) inflation was mainly driven by cost-push shocks in 2021 and early 2022, the effects of which are starting to vanish, albeit slowly, and (2) the real economy turned out to be substantially more resilient than expected a year ago.
The change in the forecast relative to December is in line with this overall narrative. Output growth is projected to be higher for 2023 than in December (0.2 percent versus -0.3 percent). The current forecast for 2024 is on par with the December forecast at 0.0 percent. The model points to another year of 0.0 percent growth in 2025, while in December output was expected to expand by 0.4 percent by the end of that year. The probability of a not-so-soft recession, defined as four-quarter GDP growth dipping below -1 percent, by the end of 2023 has declined to 41 percent, down from about 50 percent in December and 70 percent in September. Again, this probability does not reflect the implications of the current banking turmoil. The model expects the output gap to be positive but remain relatively steady over the forecast horizon, reaching 1.3 percent at the end of 2023, 1.4 percent in 2024, and 1.2 percent in 2025. This contrasts with the decline forecasted in December (1.1 percent in 2023, dropping to 0.5 percent in 2024, and then to 0.0 in 2025). Consistent with the narrative outlined above, the March inflation projections are a bit more elevated at all forecast horizons in comparison to December (3.5 versus 3.4 percent in 2023, 3.0 versus 2.8 percent in 2024, and 2.9 versus 2.6 percent in 2025), although inflation is still projected to decline over the forecast horizon.
Monetary policy is expected to be tighter in absolute terms relative to December, consistent with the January/February SPD. Relative to the expected path for the real natural rate of interest, however, policy as projected by the model may not be much more restrictive than it was in December. The r* forecasts remain at 2.0 for 2023 but have increased by about 10 basis points in 2024 and 2025 to reach 1.7 and 1.4 percent, respectively.
Forecast Comparison
| 2023 | 2024 | 2025 | 2026 | |||||
|---|---|---|---|---|---|---|---|---|
| Mar | Dec | Mar | Dec | Mar | Dec | Mar | Dec | |
| GDP growth (Q4/Q4) | 0.2 (-3.7, 4.1) | -0.3 (-5.0, 4.5) | 0.0 (-5.0, 4.9) | 0.0 (-5.0, 4.8) | 0.0 (-5.2, 5.2) | 0.4 (-4.9, 5.6) | 0.5 (-5.1, 6.2) | 0.9 (-4.6, 6.4) |
| Core PCE inflation (Q4/Q4) | 3.5 (2.9, 4.1) | 3.4 (2.7, 4.2) | 3.0 (2.2, 3.9) | 2.8 (1.9, 3.7) | 2.9 (2.0, 3.9) | 2.6 (1.6, 3.6) | 3.0 (1.9, 4.1) | 2.6 (1.5, 3.7) |
| Real natural rate of interest (Q4) | 2.0 (0.7, 3.3) | 2.0 (0.6, 3.4) | 1.7 (0.1, 3.2) | 1.6 (0.0, 3.1) | 1.4 (-0.2, 3.0) | 1.3 (-0.3, 2.9) | 1.3 (-0.4, 2.9) | 1.2 (-0.5, 2.9) |
Notes: This table lists the forecasts of output growth, core PCE inflation, and the real natural rate of interest from the March 2023 and December 2022 forecasts. The numbers outside parentheses are the mean forecasts, and the numbers in parentheses are the 68 percent bands.
Forecasts of Output Growth
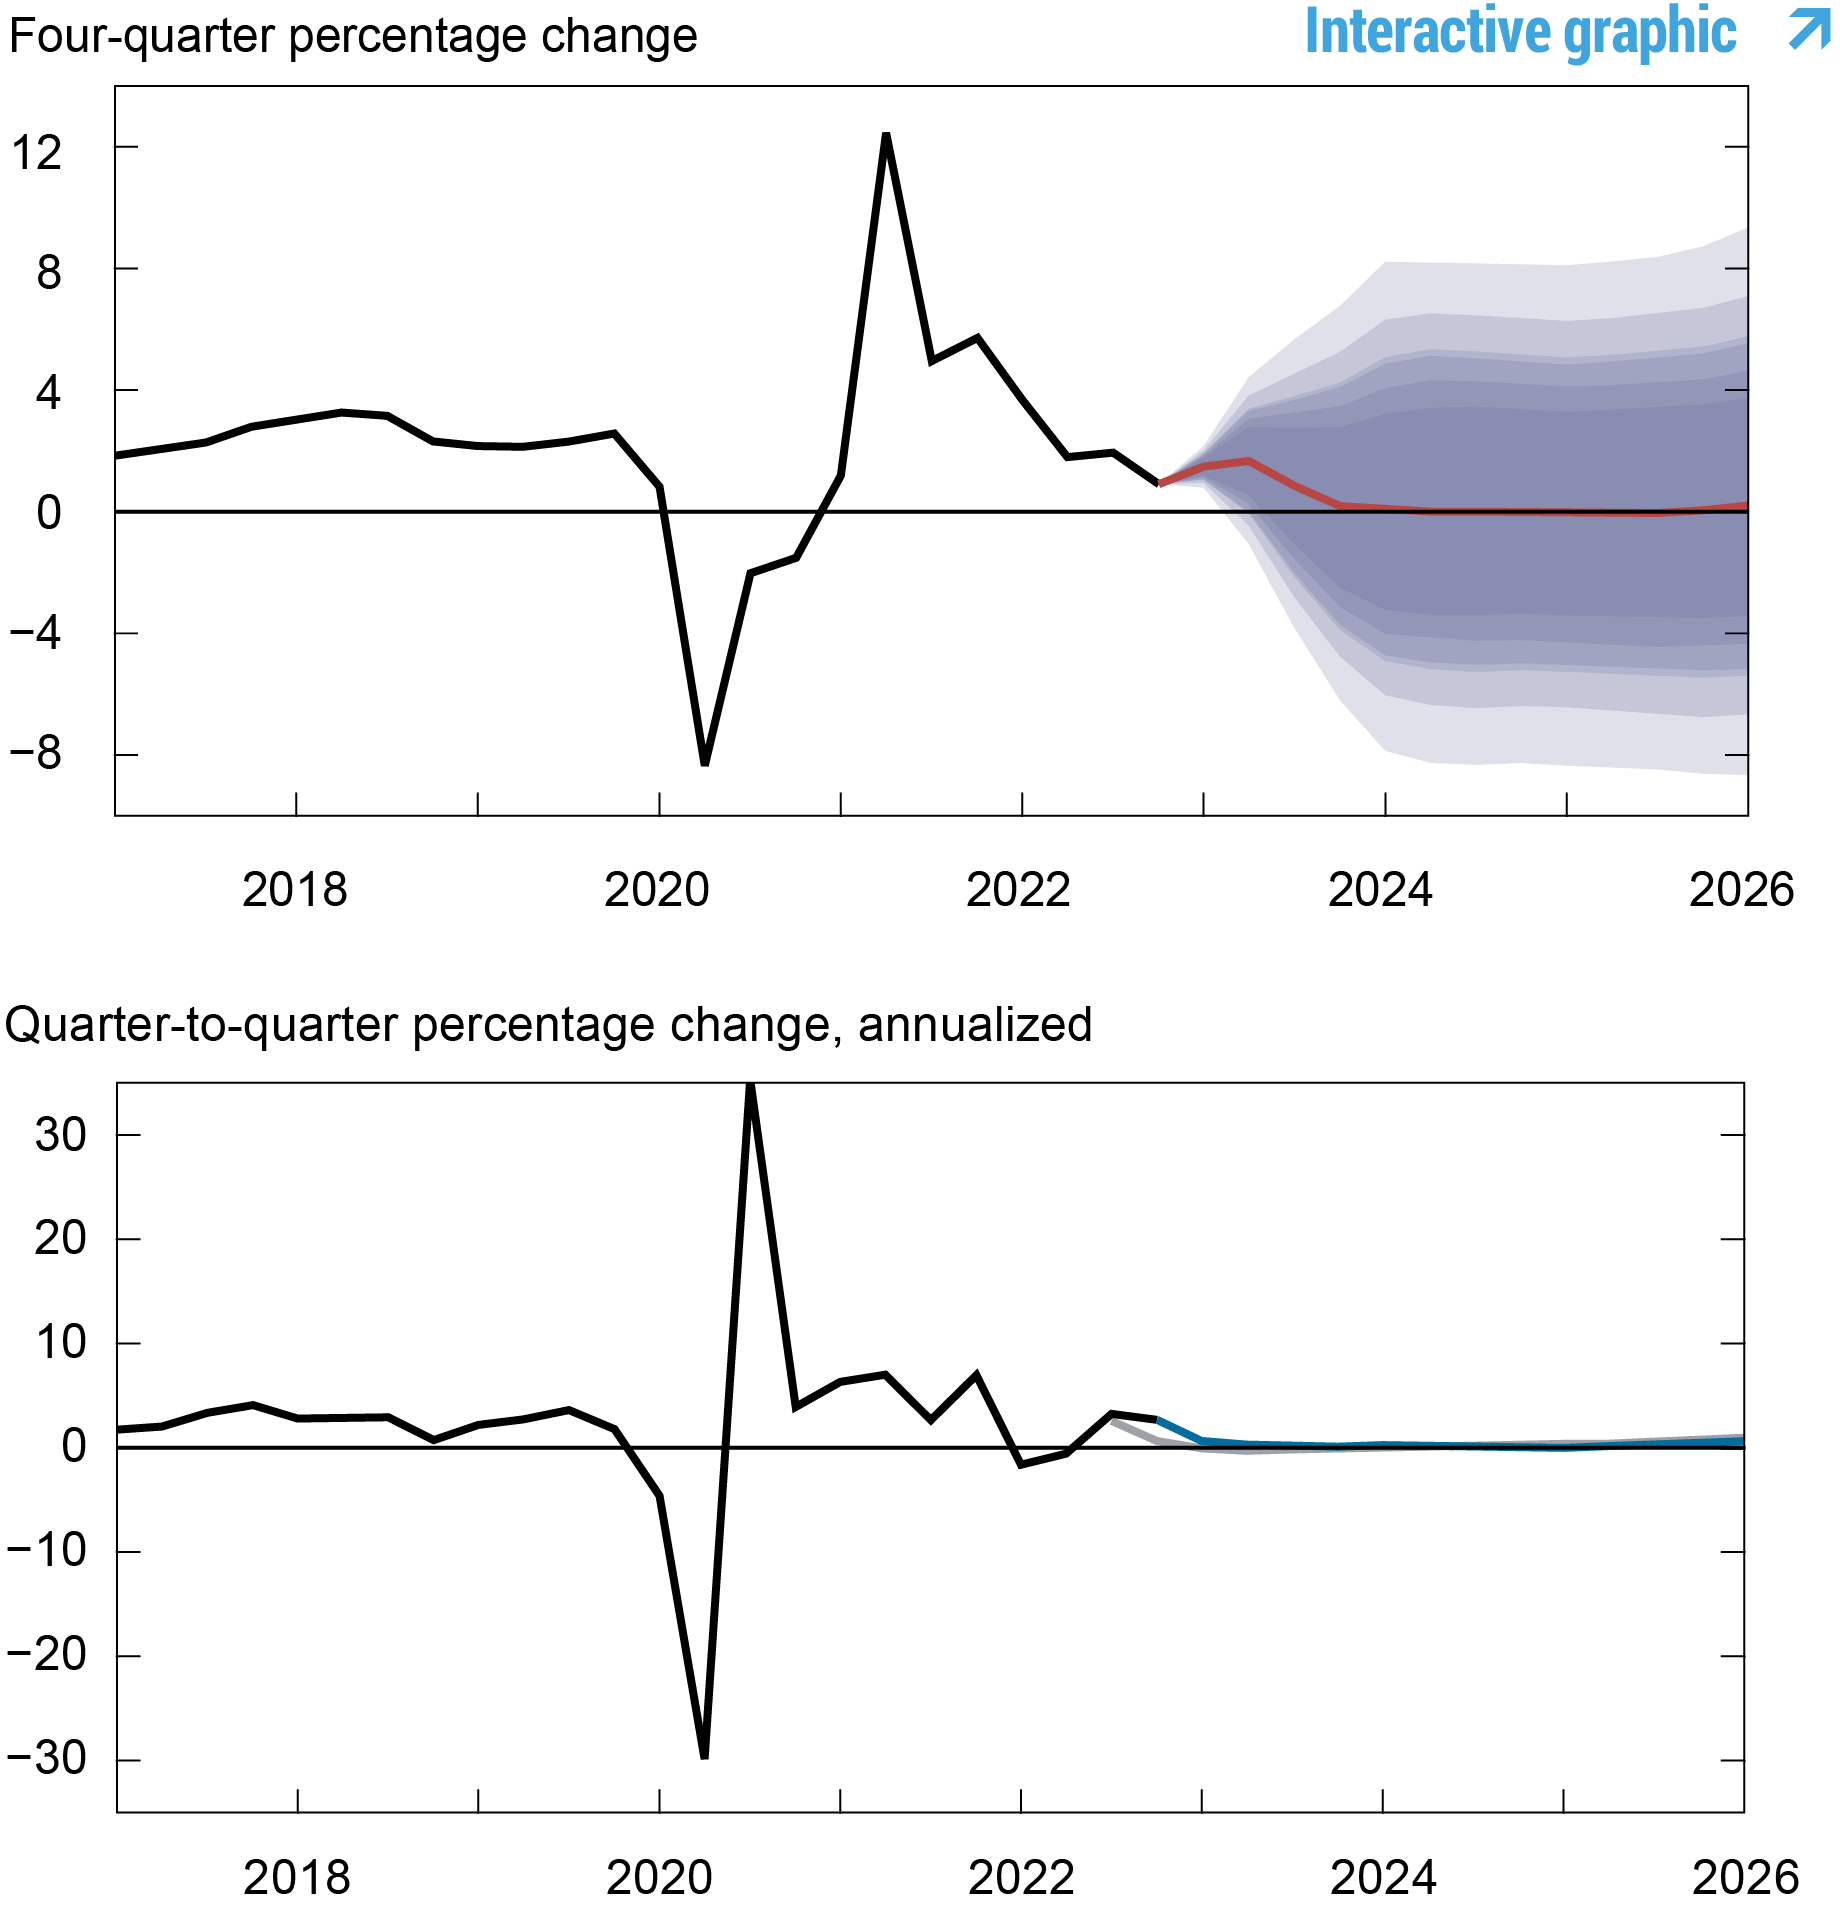
Notes: These two panels depict output growth. In the top panel, the black line indicates actual data and the red line shows the model forecasts. The shaded areas mark the uncertainty associated with our forecasts at 50, 60, 70, 80, and 90 percent probability intervals. In the bottom panel, the blue line shows the current forecast (quarter-to-quarter, annualized), and the gray line shows the December 2022 forecast.
Forecasts of Inflation
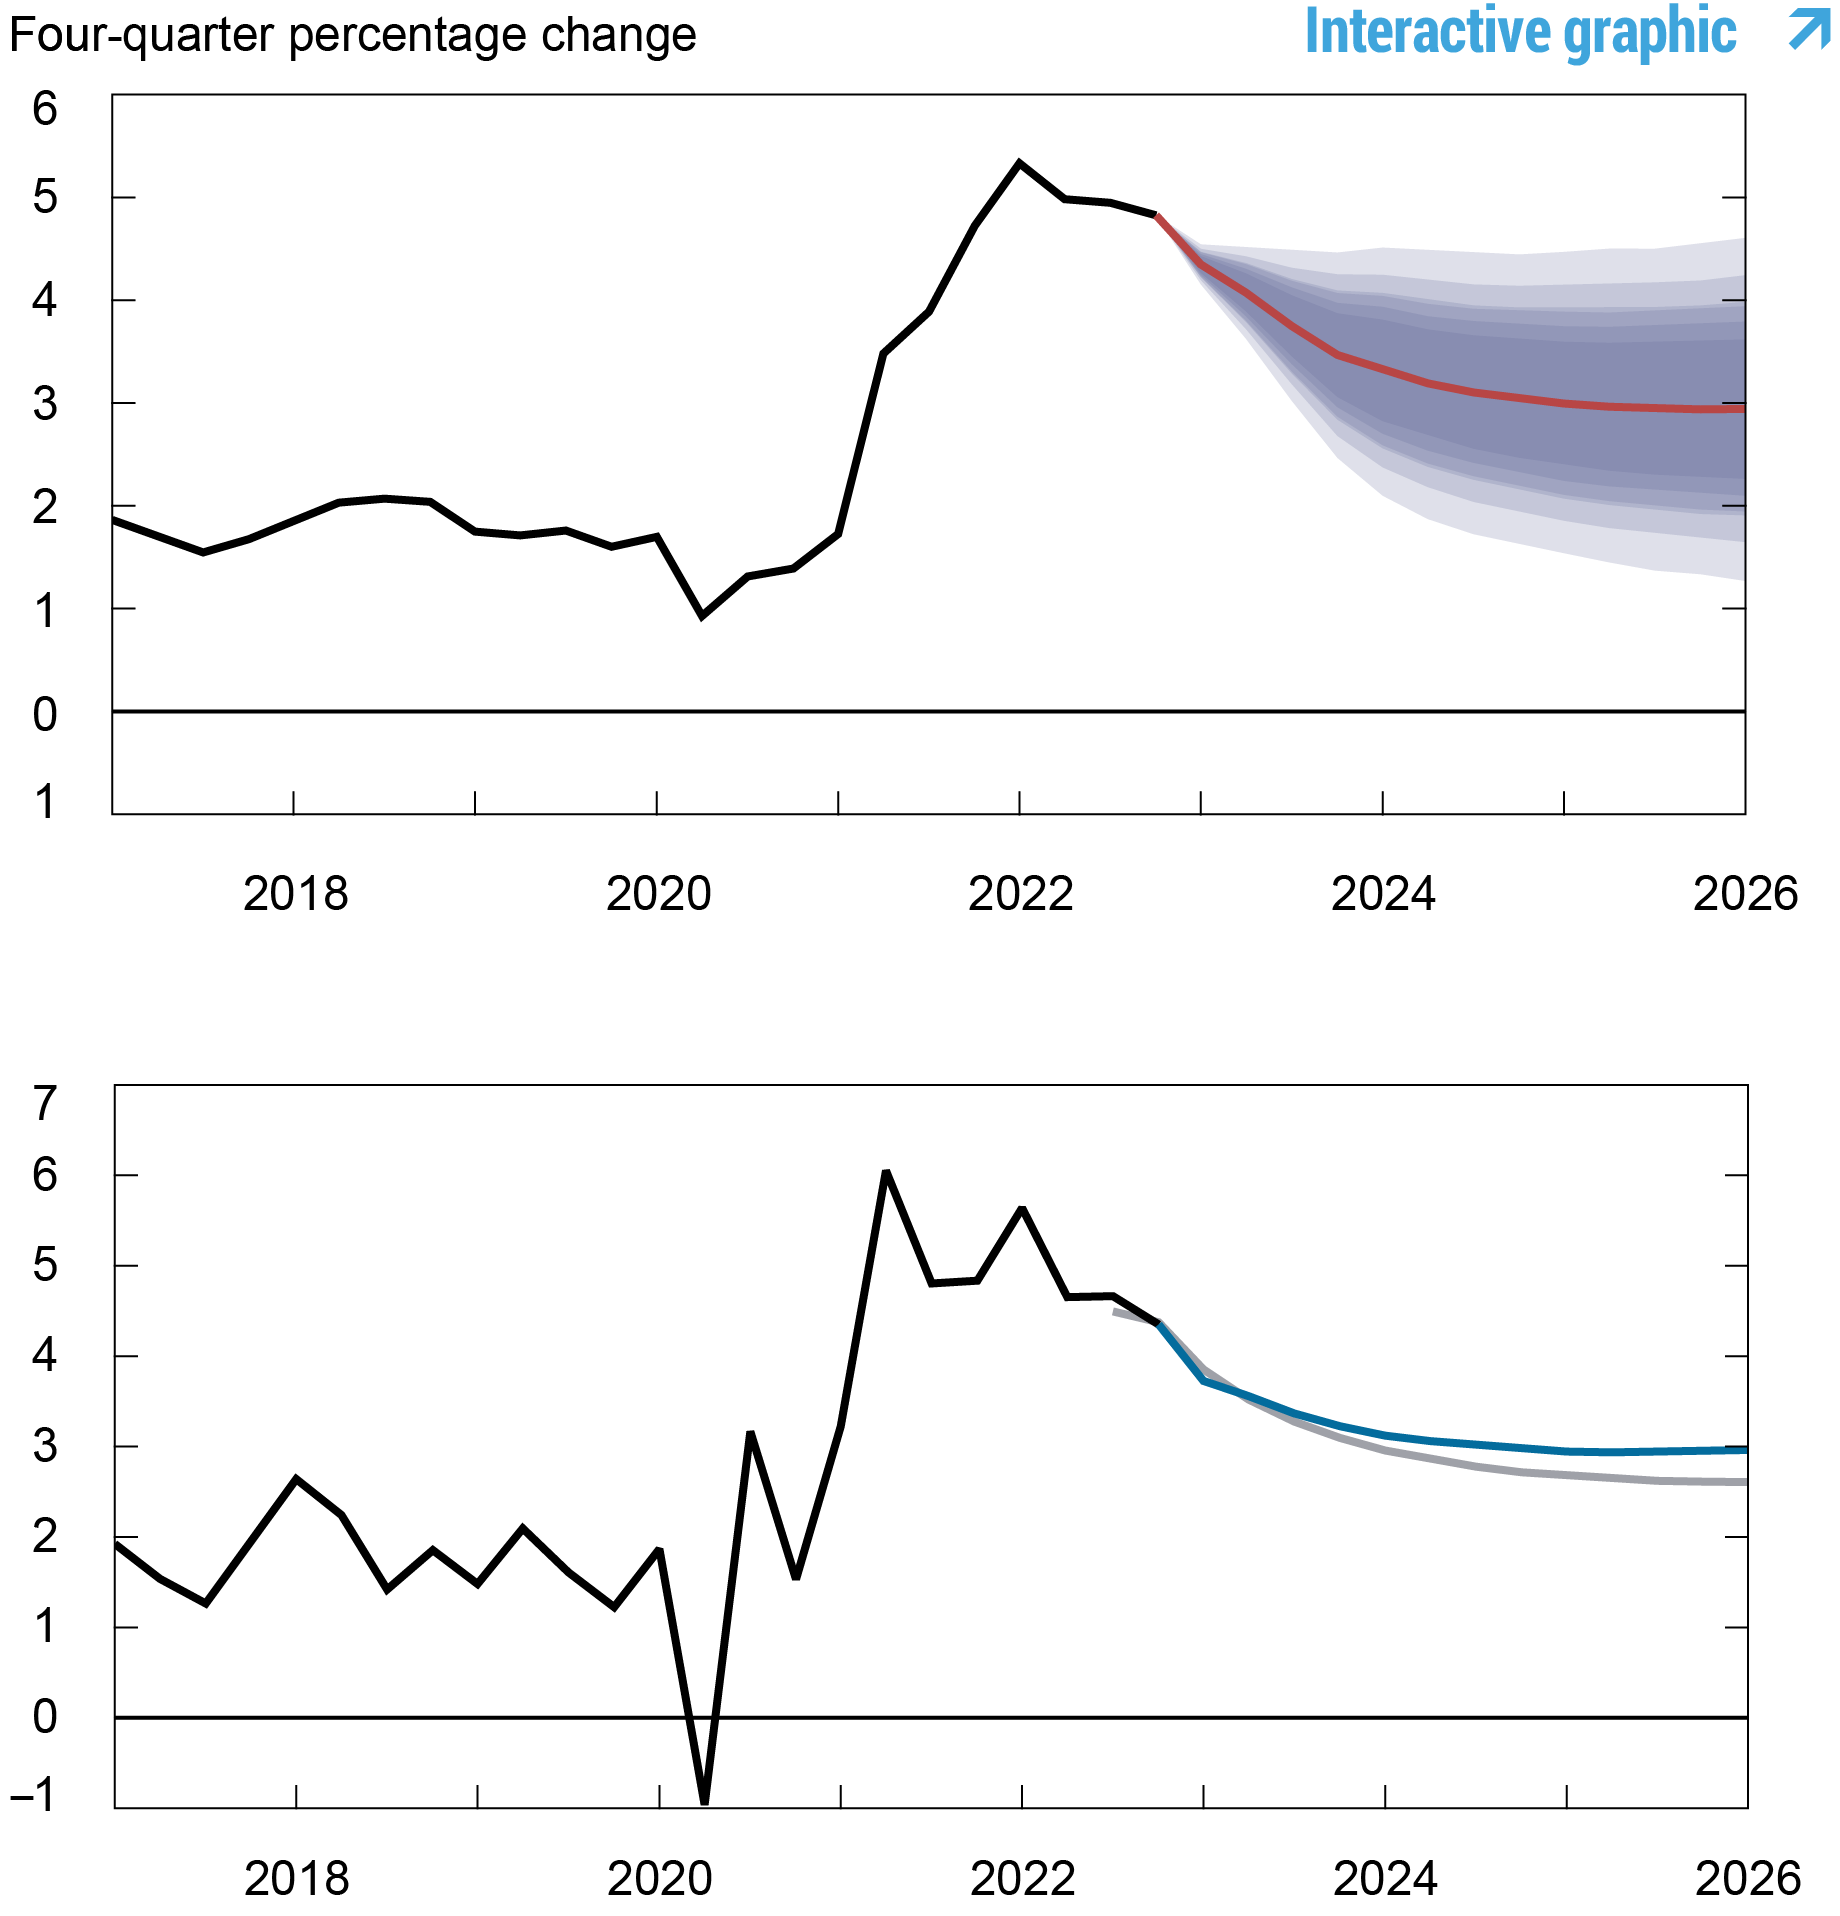
Notes: These two panels depict core personal consumption expenditures (PCE) inflation. In the top panel, the black line indicates actual data and the red line shows the model forecasts. The shaded areas mark the uncertainty associated with our forecasts at 50, 60, 70, 80, and 90 percent probability intervals. In the bottom panel, the blue line shows the current forecast (quarter-to-quarter, annualized), and the gray line shows the December 2022 forecast.
Real Natural Rate of Interest
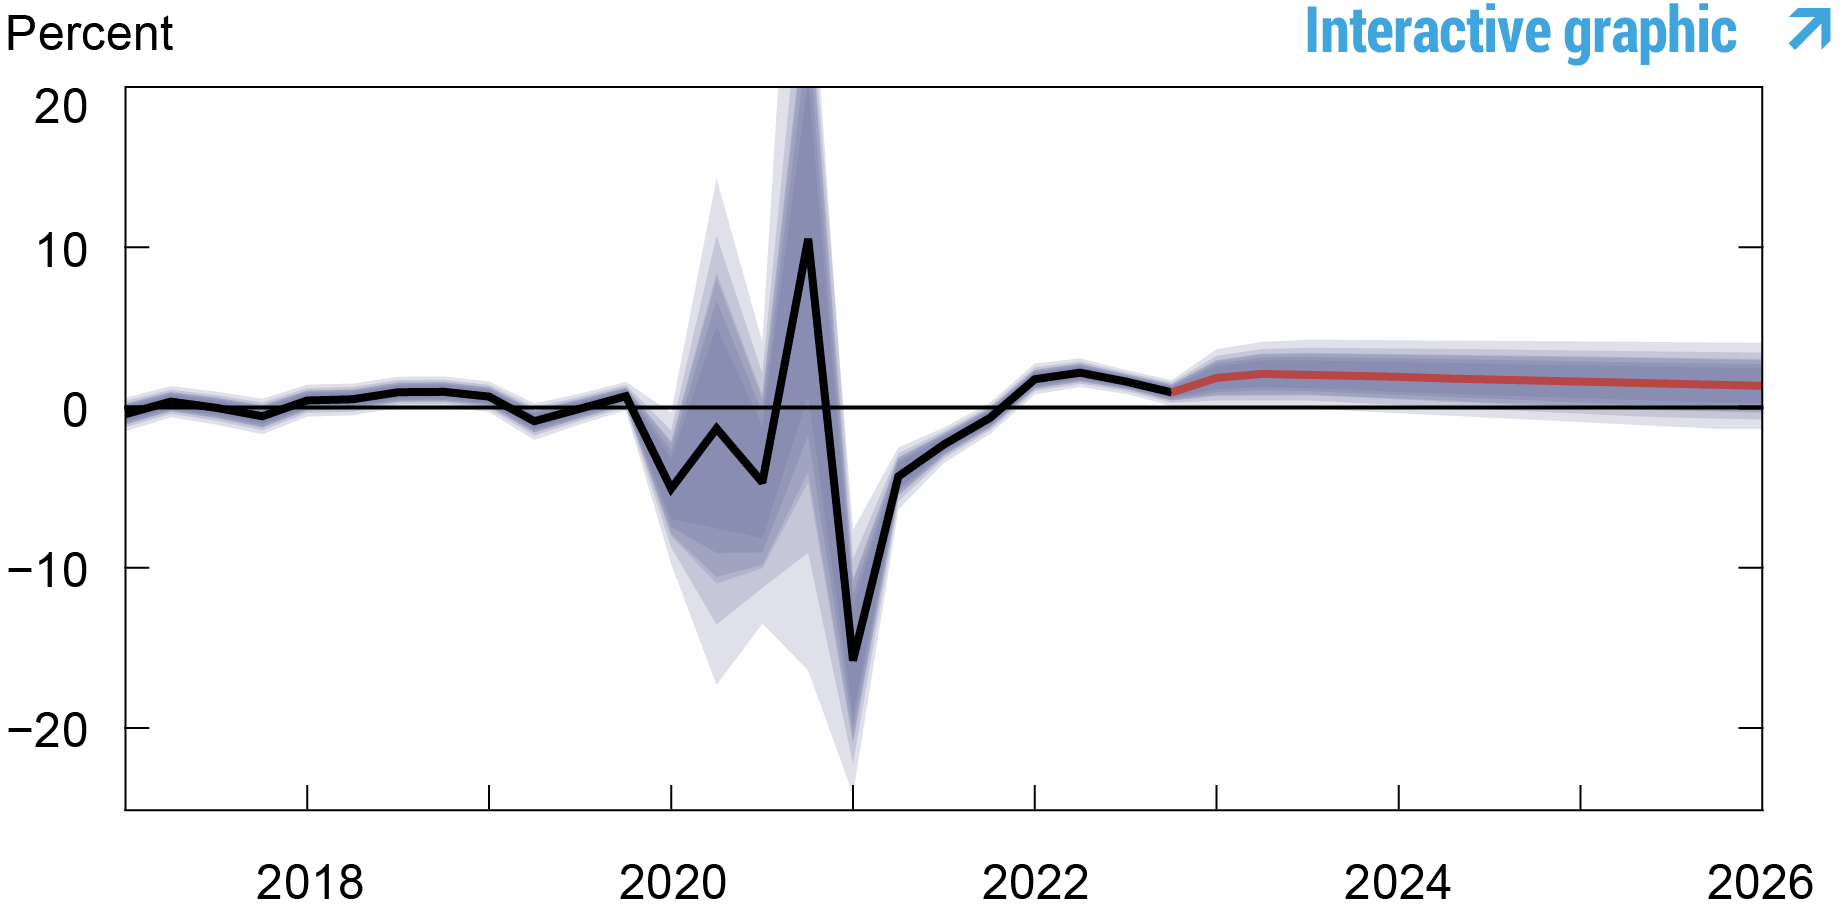
Notes: The black line shows the model’s mean estimate of the real natural rate of interest; the red line shows the model forecast of the real natural rate. The shaded area marks the uncertainty associated with the forecasts at 50, 60, 70, 80, and 90 percent probability intervals.

Marco Del Negro is an economic research advisor in Macroeconomic and Monetary Studies in the Federal Reserve Bank of New York’s Research and Statistics Group.

Aidan Gleich is a senior research analyst in the Bank’s Research and Statistics Group.

Donggyu Lee is a research economist in Macroeconomic and Monetary Studies in the Federal Reserve Bank of New York’s Research and Statistics Group.

Ramya Nallamotu is a senior research analyst in the Bank’s Research and Statistics Group.

Sikata Sengupta is a senior research analyst in the Bank’s Research and Statistics Group.
How to cite this post:
Marco Del Negro, Aidan Gleich, Donggyu Lee, Ramya Nallamotu, and Sikata Sengupta, “The New York Fed DSGE Model Forecast—March 2023,” Federal Reserve Bank of New York Liberty Street Economics, March 24, 2023, https://libertystreeteconomics.newyorkfed.org/2023/03/the-new-york-fed-dsge-model-forecast-march-2023/
BibTeX: View |


Disclaimer
The views expressed in this post are those of the author(s) and do not necessarily reflect the position of the Federal Reserve Bank of New York or the Federal Reserve System. Any errors or omissions are the responsibility of the author(s).
 RSS Feed
 Follow Liberty Street Economics