


Editor’s note: We updated the note to the table to correct a date. The most recent inflation column shows the twelve-month log percent change as of January 2023, not November 2022. (Feb. 22, 1:30 p.m.)

Inflationary pressures—their determinants and evolution—continue to dominate policy discussions. In this post, we provide a simple framework to analyze the determinants of different measures of inflation and use it to lay out a risk-scenario analysis. We find that global supply factors captured by the New York Fed’s Global Supply Chain Pressure Index (GSCPI) are strongly associated with inflationary developments measured by the producer price index (PPI) and by the c0nsumer price index (CPI). Under the assumption that the GSCPI falls back to its historical average over twelve months, our model would project a substantial easing of consumer price inflation over 2023 to below 4.0 percent. The normalization of the GSCPI would then be consistent with a return of inflation to levels consistent with a soft-landing scenario.
U.S. Inflation and Its Determinants
We formally quantify the contemporaneous correlations between different measures of inflation for the United States and global supply and demand factors using monthly data from 1998 to 2022. As in our earlier blog post (“The Global Supply Side of Inflationary Pressures”), we run linear regressions that relate the different measures of year-on-year inflation rates with our GSCPI measure, a measure of potential demand factors (see our companion blog post for the computation of demand factors), year-on-year changes in the broad nominal trade-weighted U.S. dollar index, as well as our estimate of the global oil supply factor behind year-on-year oil price changes. This approach yields the average monthly correlations between the inflation measures and our demand and supply factors for a sample of data going back to 1998.
Although we do not report the estimated coefficients here, three key results are worth highlighting from our analyses. First, both global supply and global demand factors are associated with intermediate demand goods PPI inflation, consistent with the globally traded nature of the goods in this index. Second, the U.S.-specific demand factor becomes relevant in contributing to CPI inflation on top of supply components captured by the GSCPI. Third, as could be expected, the GSCPI is more associated with goods CPI inflation than with overall inflation.
We next use the estimated regression relationships to explore how these supply and demand factors have correlated with recent inflation developments. We do so by first re-running the regressions using data through June 2021. We then use the regression estimates along with the observed values of the GSCPI, demand factors, exchange rate changes, and global oil supply factors from June 2021 to January 2022 to calculate projected inflation rates from the model.
The upper panel of the chart below shows the results for PPI inflation. The regression models do a quite good job at tracking PPI inflation, while the bottom panel of the chart illustrates that the models can track the changes in overall CPI inflation, though, in that case the levels of inflation are much higher than our model predicts. This is consistent with the notion that PPI is relatively more influenced by global factors compared to broader measures of consumer prices that include larger weights on non-tradable services.
GSCPI Model Can Explain Much of Recent PPI Trends, but Less of CPI
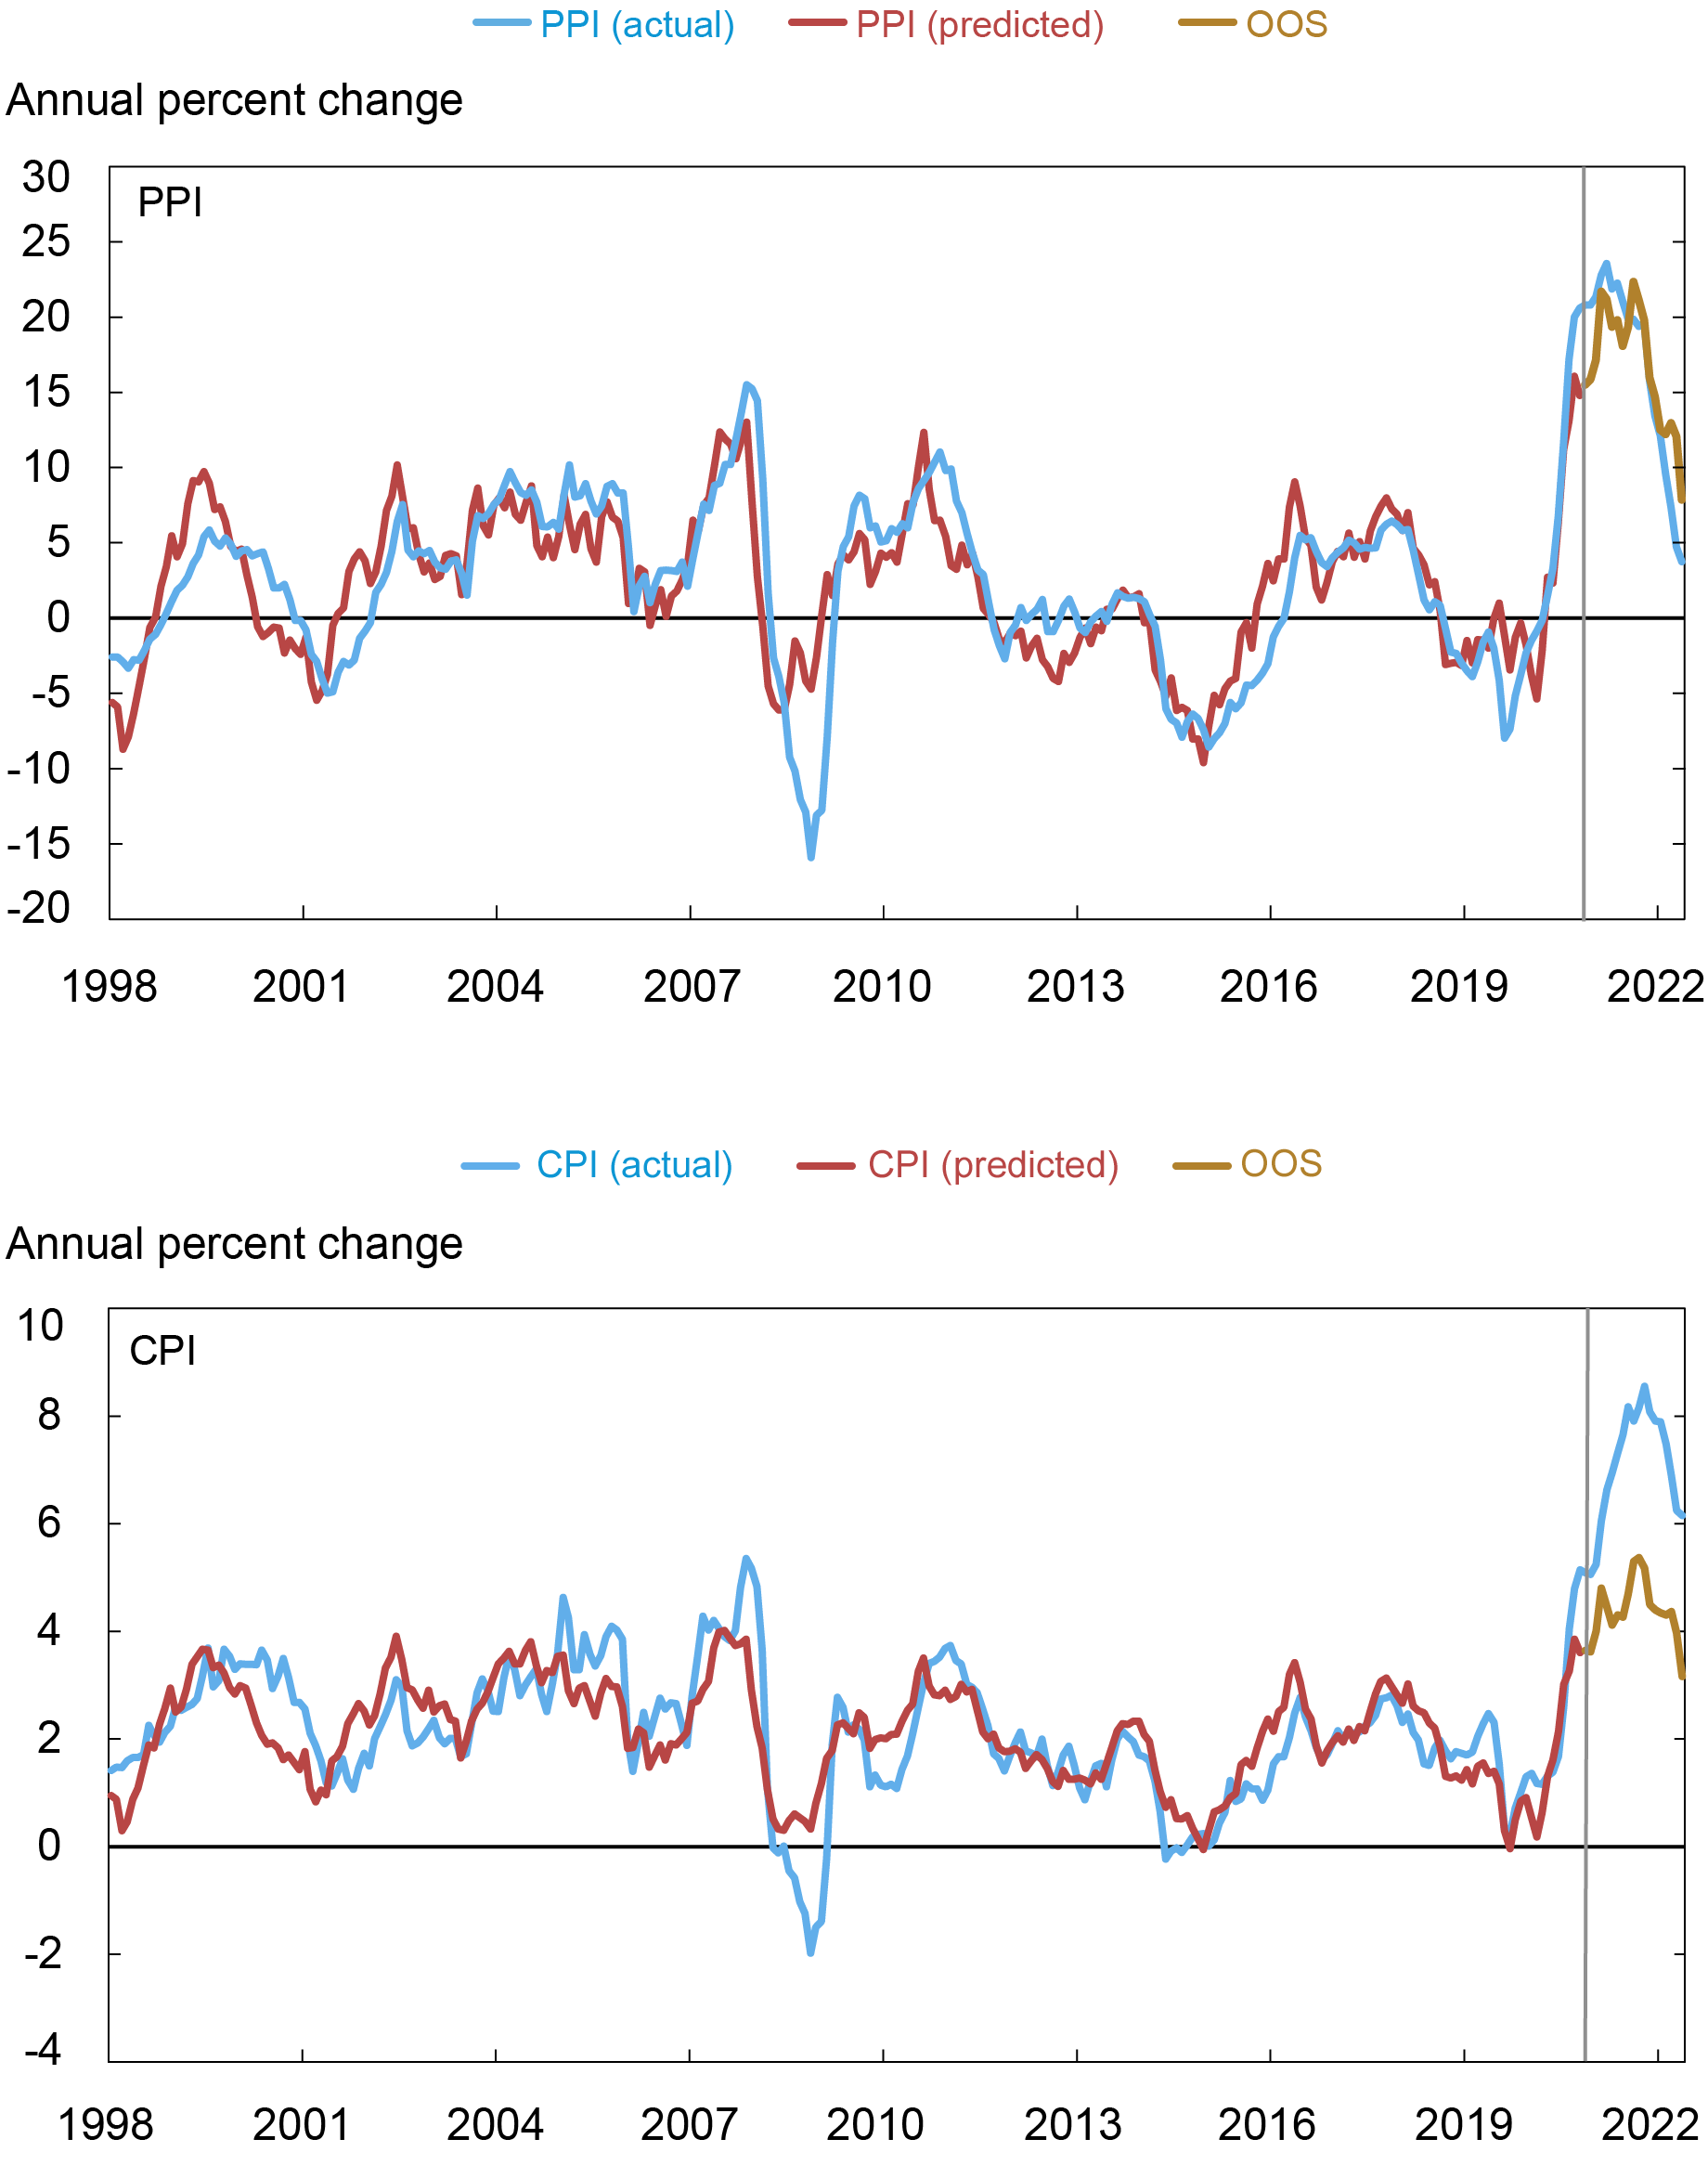
Note: The vertical line indicates when the out-of-sample estimates begin (July 1, 2021).
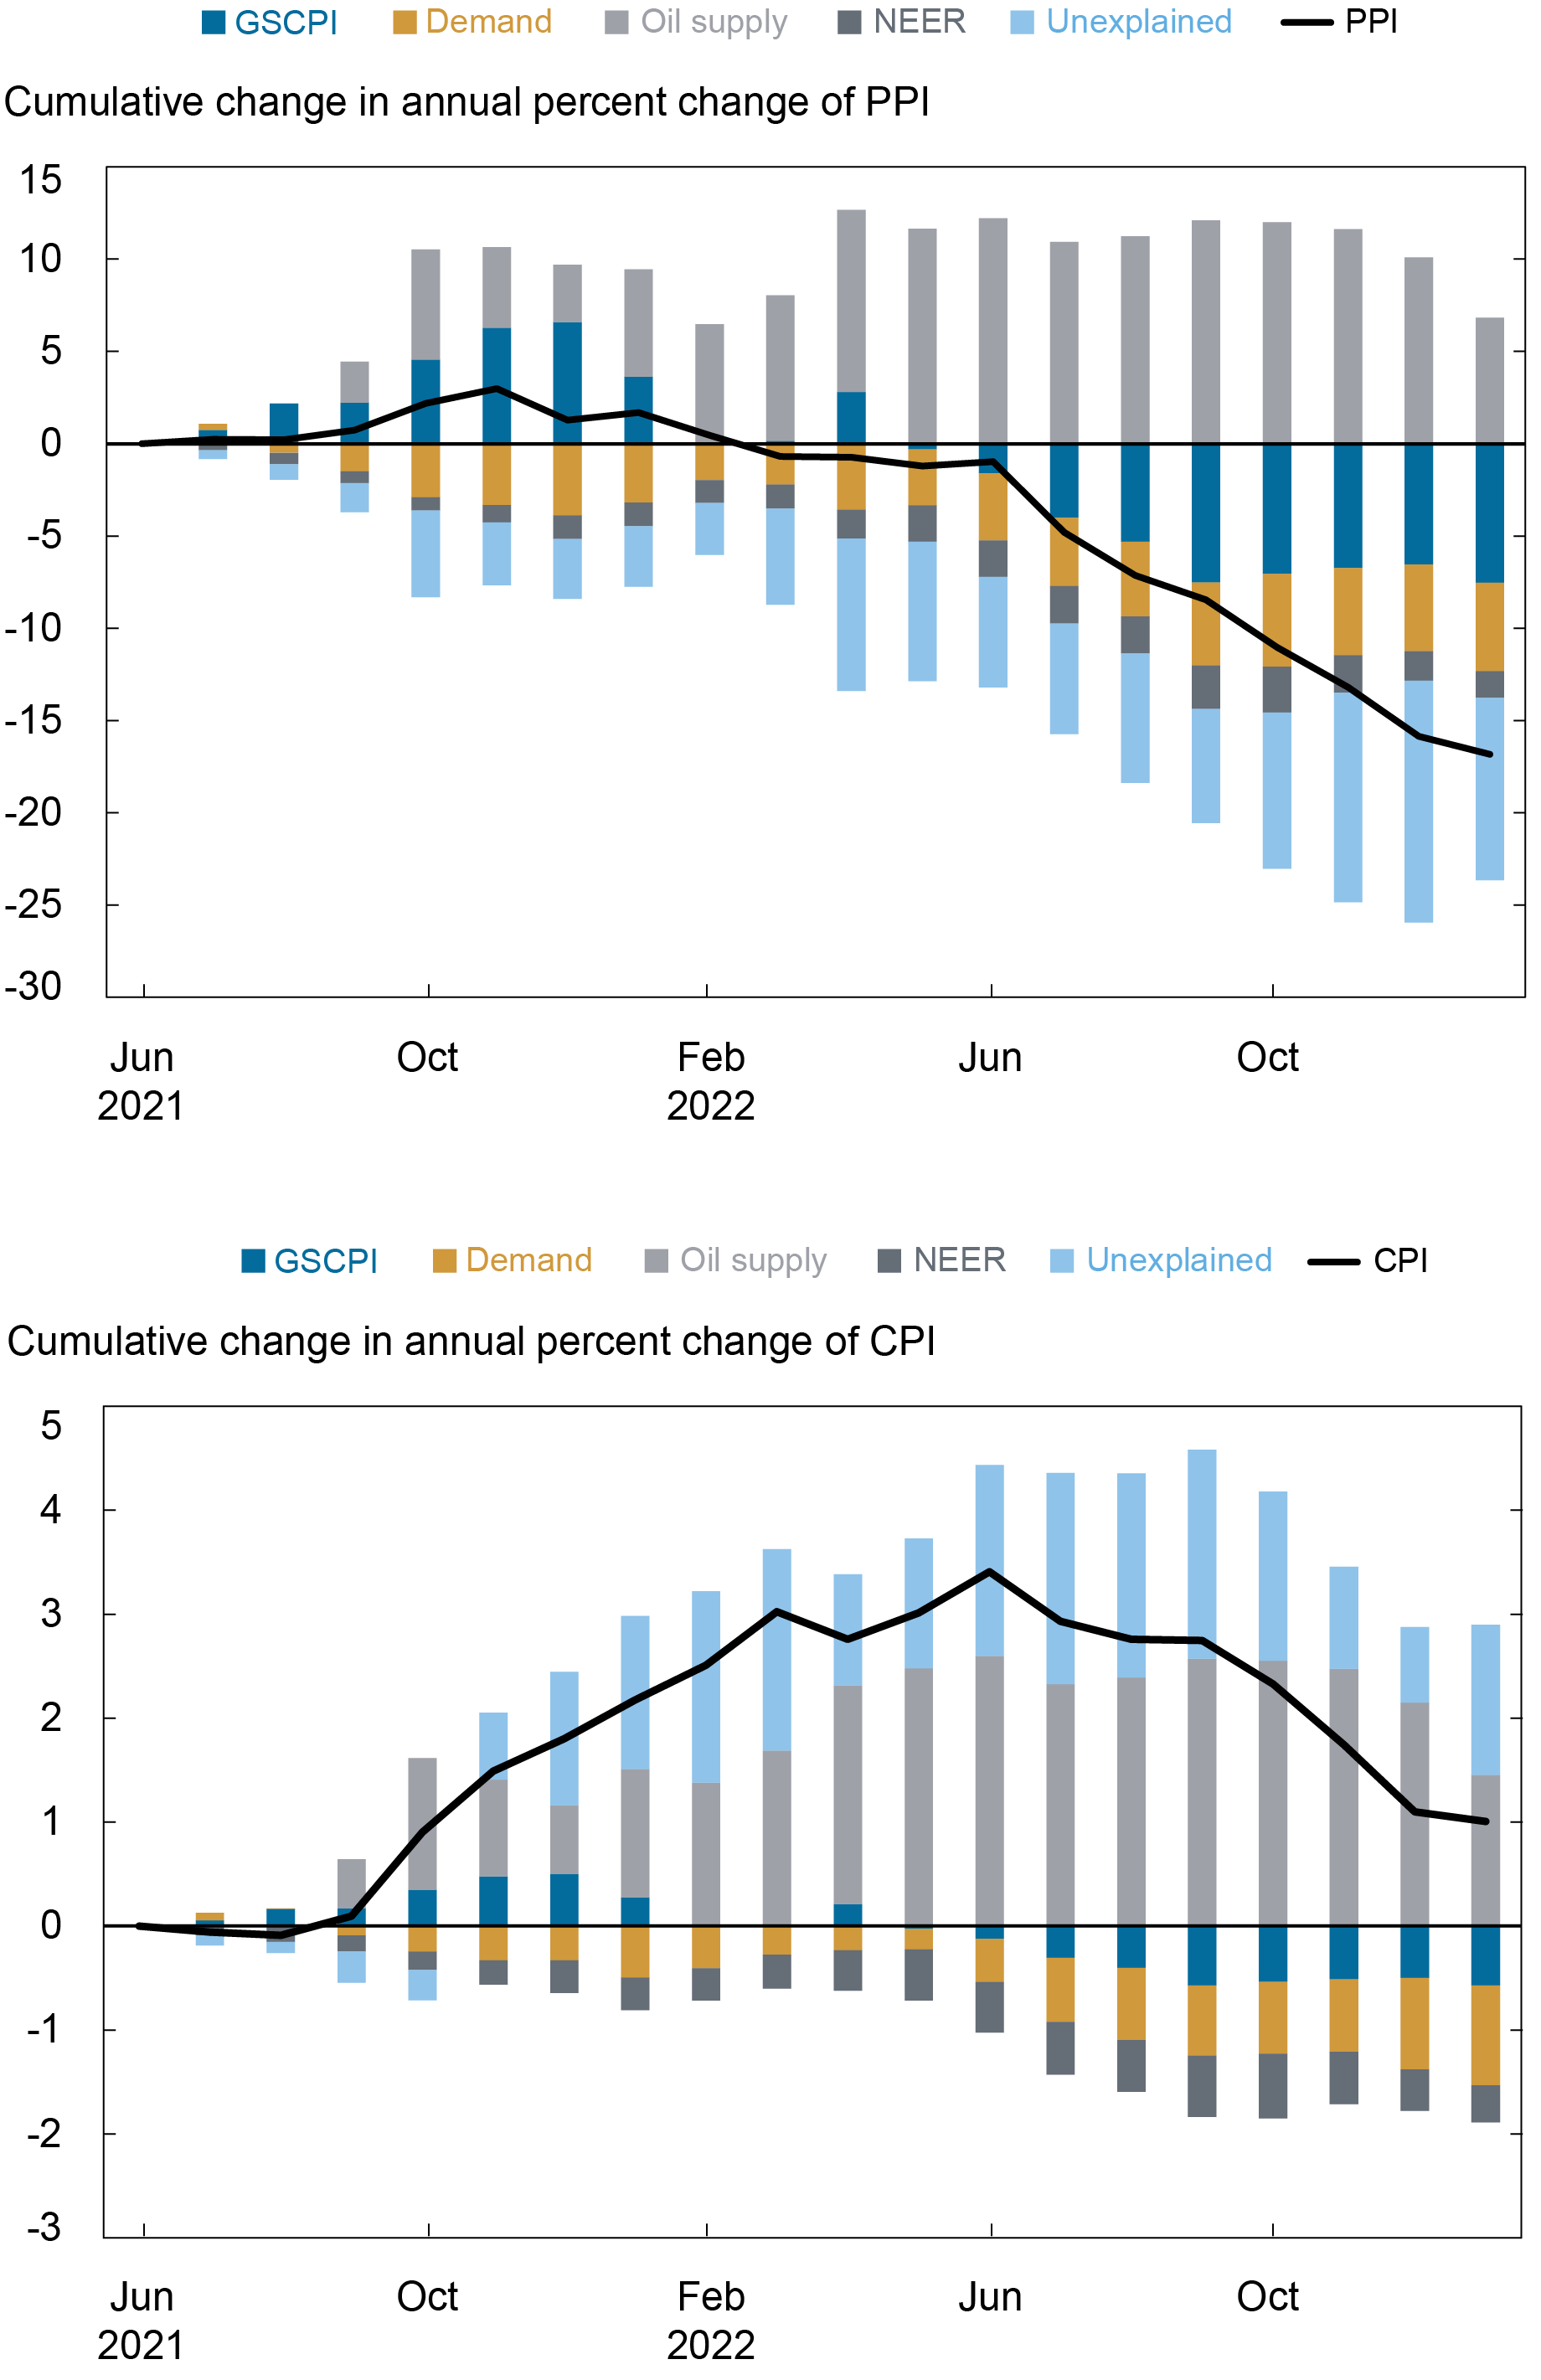
The next panel of charts displays the contributions of our demand and supply factors to the fluctuations in the prior chart. These charts highlight how different factors shape the inflation dynamics in the most recent period. Once we focus on headline CPI (and goods CPI, not shown) we see that the extracted demand component and the GSCPI have become relatively more important in contributing to the recent disinflation while the dollar’s appreciation has had a disinflationary effect from the beginning of 2022. Across all our measures of inflation, the oil supply component emerges as a sizeable inflationary component through the sample period.
All Components except Oil Contribute Negatively to Inflation
Twelve-Month-Ahead Inflation Projections
We next use the estimated relations to project the evolution of twelve-month-ahead U.S. inflation under two cases. As a baseline scenario, we assume continued easing of global supply chain bottlenecks such that GSCPI indicator returns to its historical average over the course of a year (from about 1 to zero) and the oil supply component holds steady at its most recent level. Our alternative scenario is the one in which we assume global supply chain bottlenecks show no further improvement over the next twelve months (remaining steady at 1) and oil prices increase by 30 percent from current levels due to disruption in oil supply. We refer to this scenario as the risk-shock scenario. In all these scenarios, we abstract from the demand and the dollar components, holding them unchanged at their current levels.
The table below illustrates the conditional inflation outlook for different measures of inflation over the year horizon. First, we focus on the baseline scenario (first row of the table). We note that, building on our model, just the normalization of the GSCPI would entail a substantial easing of inflationary pressures even at the headline CPI level abstracting from other potential disinflationary forces. Second, we focus on our risk-shock scenario that combines both supply chain disruptions and an oil price shock, as described above. This would create much more persistent inflation with CPI inflation only falling to 5.9 percent. The risk-shock scenario illustrates the need for persistent shocks to slow down the natural adjustment of inflation, especially at the level of goods CPI (not shown).
Inflation Outlook Scenario Analysis: Baseline vs. Risk Shock
| Scenario | Most Recent Inflation | Inflation Rate after Twelve Months | |||
|---|---|---|---|---|---|
| Baseline | CPI | 6.2 | 3.8 | ||
| PPI | 3.7 | -5.4 | |||
| Risk Shock | CPI | 6.2 | 5.9 | ||
| PPI | 3.7 | 3.7 | |||
Conclusion
In this post we use a regression model to identify the contributions of demand and supply components in determining PPI and CPI inflation rates. We then use our analysis to draw the implications for these measures of inflation of a normalization of the GSCPI over a one-year horizon: we find that in this case CPI inflation would return to 3.8 percent within twelve months other things kept equal.

Ozge Akinci is an economic research advisor in International Studies in the Federal Reserve Bank of New York’s Research and Statistics Group.

Gianluca Benigno is a professor of economics at the University of Lausanne and former head of International Studies in the Federal Reserve Bank of New York’s Research and Statistics Group.

Hunter L. Clark is an international policy advisor in International Studies in the Federal Reserve Bank of New York’s Research and Statistics Group.

William Cross-Bermingham is a research analyst in the Federal Reserve Bank of New York’s Research and Statistics Group

Ethan Nourbash is a research analyst in the Federal Reserve Bank of New York’s Research and Statistics Group.
How to cite this post:
Ozge Akinci, Gianluca Benigno, Hunter L. Clark, William Cross-Bermingham, and Ethan Nourbash, “How Much Can GSCPI Improvements Help Reduce Inflation?,” Federal Reserve Bank of New York Liberty Street Economics, February 22, 2023, https://libertystreeteconomics.newyorkfed.org/2023/02/how-much-can-gscpi-improvements-help-reduce-inflation/
BibTeX: View |


A New Barometer of Global Supply Chain Pressures

Disclaimer
The views expressed in this post are those of the author(s) and do not necessarily reflect the position of the Federal Reserve Bank of New York or the Federal Reserve System. Any errors or omissions are the responsibility of the author(s).
 RSS Feed
 Follow Liberty Street Economics