


The surge in wage growth experienced by the U.S. economy over the past two years is showing some tentative signs of moderation. In this post, we take a closer look at the underlying data by estimating a model designed to isolate the persistent component—or trend—of wage growth. Our central finding is that this trend may have peaked in early 2022, having experienced an earlier rise and subsequent moderation that were broad-based across sectors. We also find that wage growth seems to be moderating more slowly than the trend in services inflation.
Has Wage Growth Started to Moderate?
Our model decomposes wage growth in each sector of the economy into the sum of a persistent component common to all sectors, a persistent component specific to that sector, and some transitory shocks. Through this decomposition, we can assess whether the sharp increase in wage growth experienced by the U.S. economy over the past two years is broad-based or driven by specific sectors. This sectoral approach is motivated by the substantial reallocation of workers across different sectors of the economy triggered by the pandemic, which is likely to have affected aggregate wage growth.
The model is estimated using monthly data on nominal wages from the Current Population Survey (CPS). Following the well-established approach of the Atlanta Fed Wage Growth Tracker, we define wage growth as the median percent change in the hourly wage of individuals, observed twelve months apart. An attractive feature of this definition is that aggregate wage growth can be readily decomposed by job or demographic characteristics. In this blog post, we break down aggregate changes in nominal wages into seven sectors of the economy.
Extending a model that we recently used to measure the persistence of inflation, we recover the trend in unobserved monthly wage growth from year-over-year wage changes. This technical adjustment accommodates the structure of the CPS data while ensuring that the model is not putting too much weight on past data, which would artificially delay a potential turning point in the trend.
The chart below shows our estimated trend (solid blue line) together with the realized twelve-month wage growth defined as described above (dashed black line). The shaded area around the trend is a 68 percent confidence band that captures the uncertainty associated with the estimate. We highlight two main takeaways.
Wage Growth and Its Persistent Component
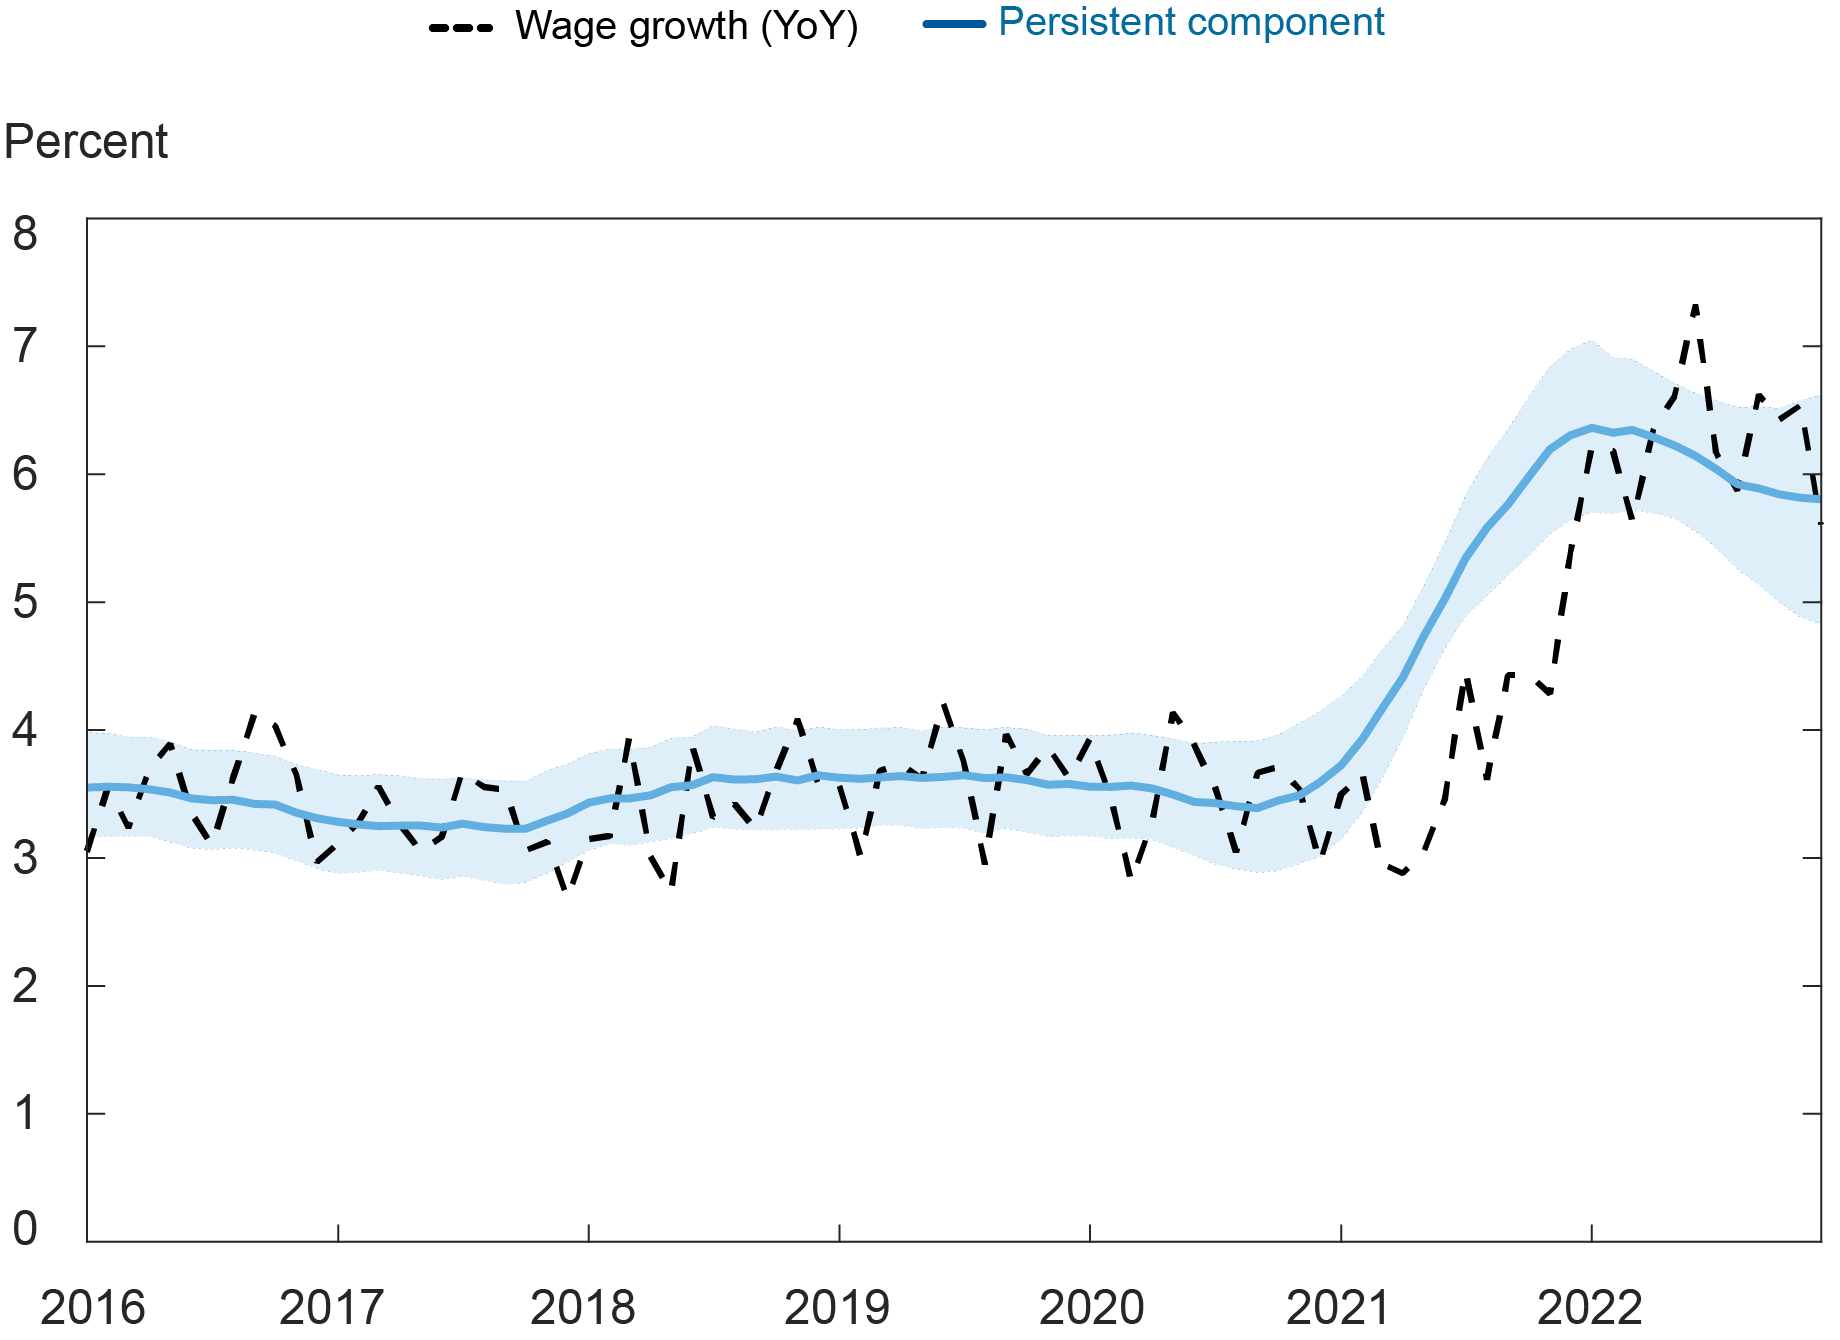
First, the trend remained stable between 3.2 percent and 3.7 percent between 2016 and 2020. Hence, most fluctuations in observed wage growth over that period, including those in the first part of the pandemic, can be ascribed to transitory shocks. Starting in early 2021, the trend increased markedly, nearly doubling over the course of the year. As such, a large chunk of the wage growth we saw over the course of 2021 appears to be persistent. It is worth stressing once more that the trend extracted by the model is expressed in terms of annualized monthly wage growth, which explains why it leads the actual year-over-year wage growth series in the chart.
Second, the model suggests that the trend may have peaked in the early months of 2022, then started to decline. But, as shown by the shaded areas, there remains considerable uncertainty around the pace of this slowdown in the trend component of wage growth. If anything, our model estimates indicate that it cannot be ruled out that wage growth will continue to be markedly higher in the near term than it was before the pandemic. We next turn to investigating which sectors contributed the most to the increase in the persistent component of wage growth, and how widespread the recent moderation is.
Is the Persistence of Wage Growth Driven by Specific Sectors?
We retrieve the persistent components for the seven broad sectors that are featured in our analysis and then recover the incidence of each of these sectors on the aggregate. This allows us to evaluate the role that these different sectors played in the recent evolution of wage growth, as shown in the chart below. We allocate the cumulative change in trend wage growth to each sector (measured by the deviation from the average 2017-19 level of the aggregate trend).
Sectoral Decomposition of Persistence in Wage Growth
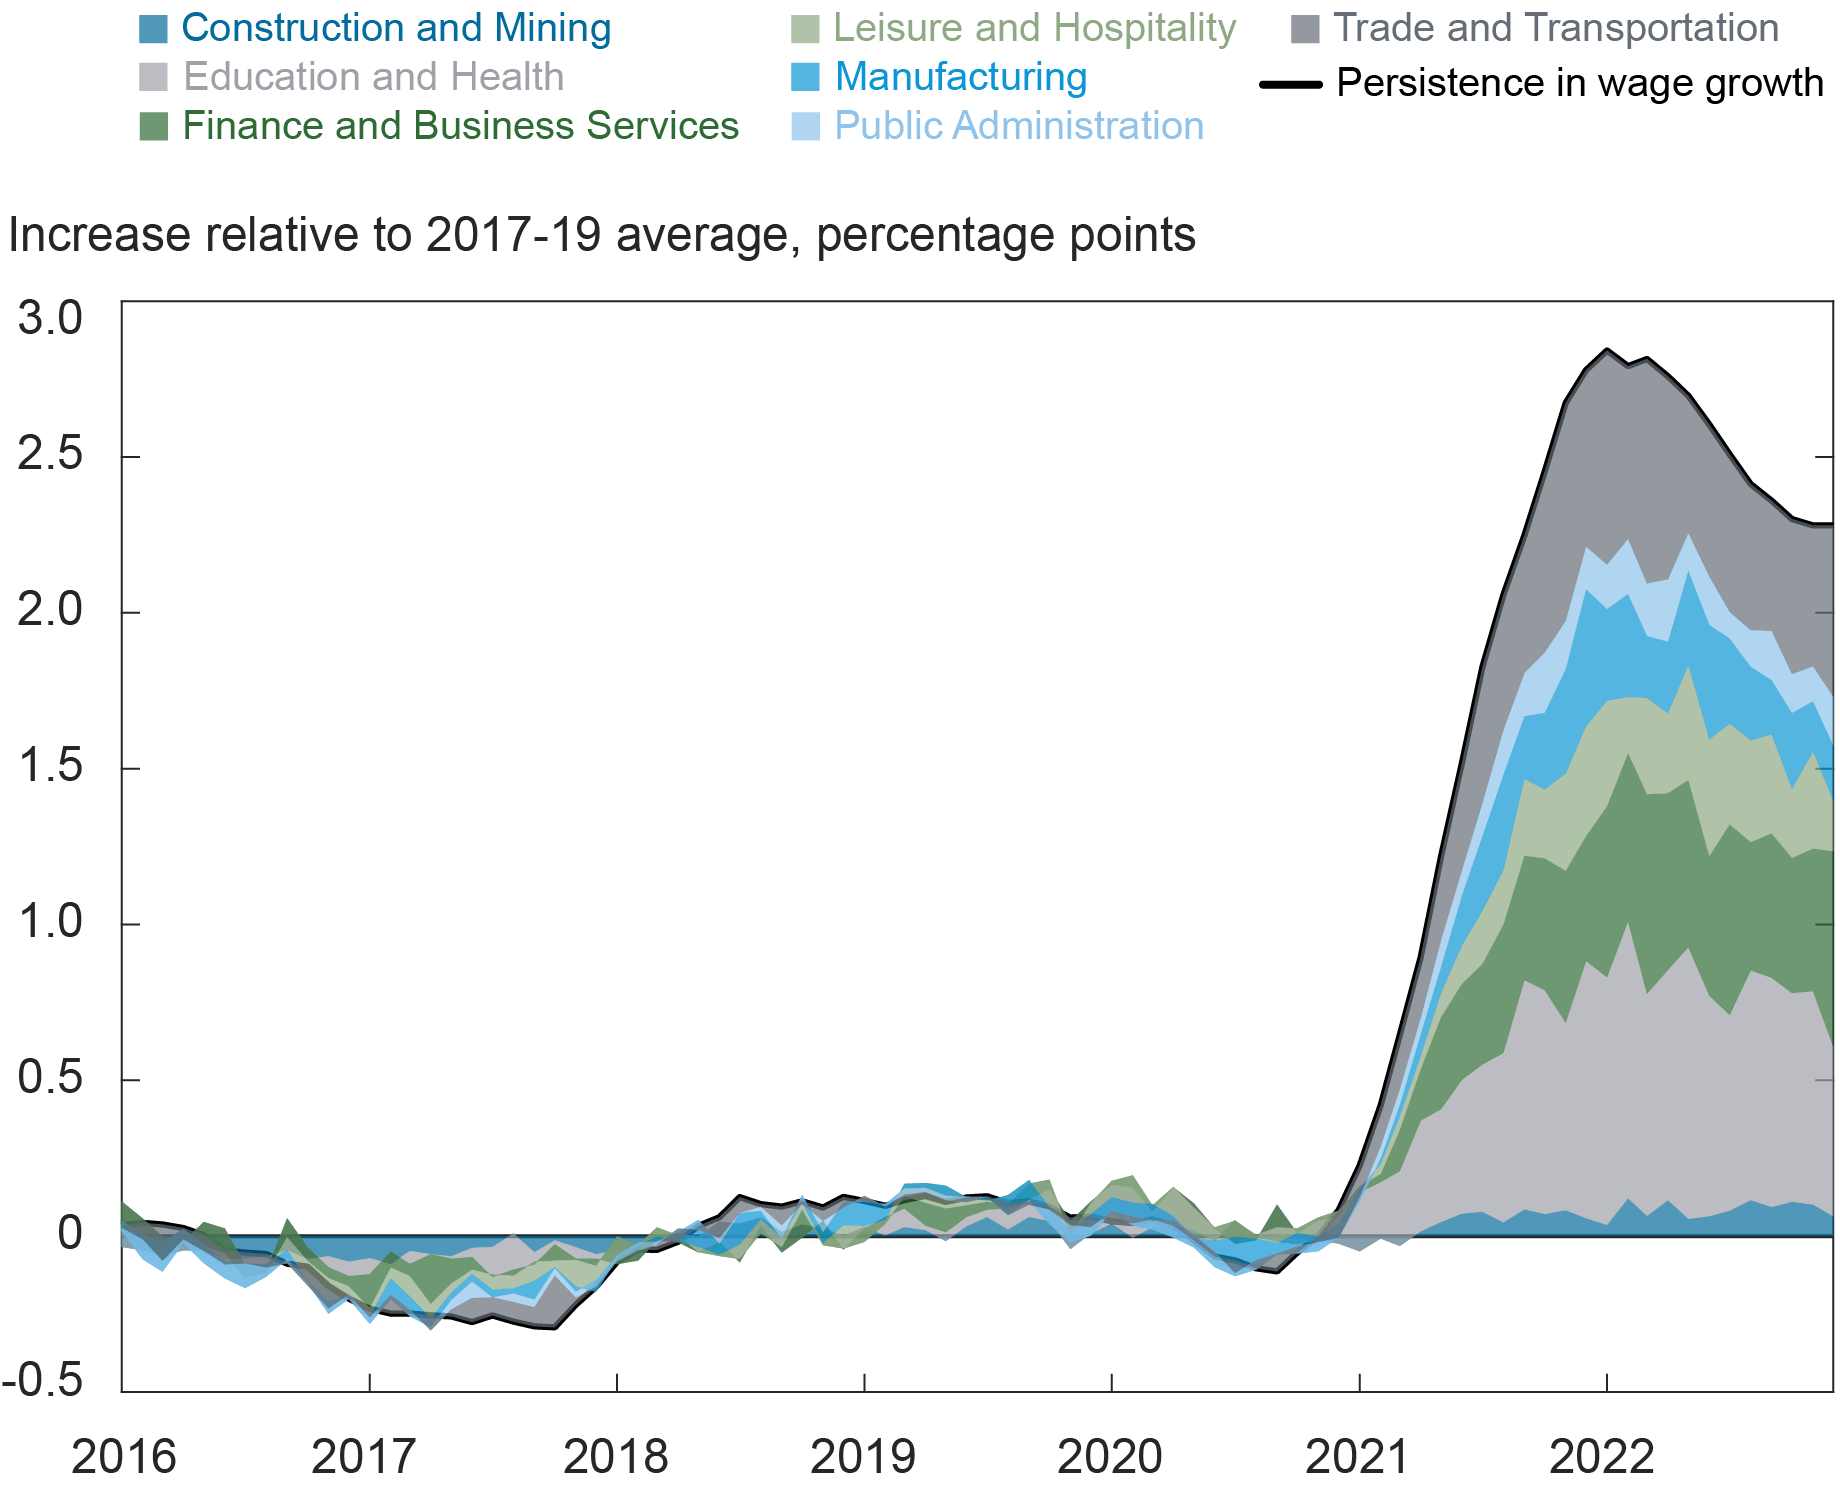
While sectors differ in terms of their contribution to the persistence of wage growth, the surge observed in 2021 is broad-based. Three industries moved first and contributed to more than half of the observed aggregate increase: education and health, finance and business services, and trade and transportation. Interestingly, leisure and hospitality had a relatively small contribution to the overall trend dynamics. While the estimated trend specific to that sector has gone up, this increase has been limited.
Since early 2022, most sectors have shown a deceleration, if not a fall, in the persistent component of wage growth. No specific sector, however, seems to be behind the recent decline in the overall trend component. In addition, the decline in persistence in some sectors, such as trade and transportation, recently stalled or even reverted. All in all, this suggests that focusing on specific sectors of the economy is not particularly helpful in explaining the persistence of wage growth, but a more comprehensive approach is needed, as we expand on next.
How Widespread Are Trend Dynamics?
While some sectors played a bigger role in the earlier increase and subsequent deceleration of the aggregate trend in wage growth, these changes appear widespread across the economy. In the chart below, we distinguish between changes in trend that are common across sectors and changes in trend that are specific to each sector. Like the sectoral breakdown shown above, the common and sector-specific wage growth trends are shown in deviation from their respective average over 2017-19.
Persistence of Wage Growth: Common or Sector-Specific Trend?
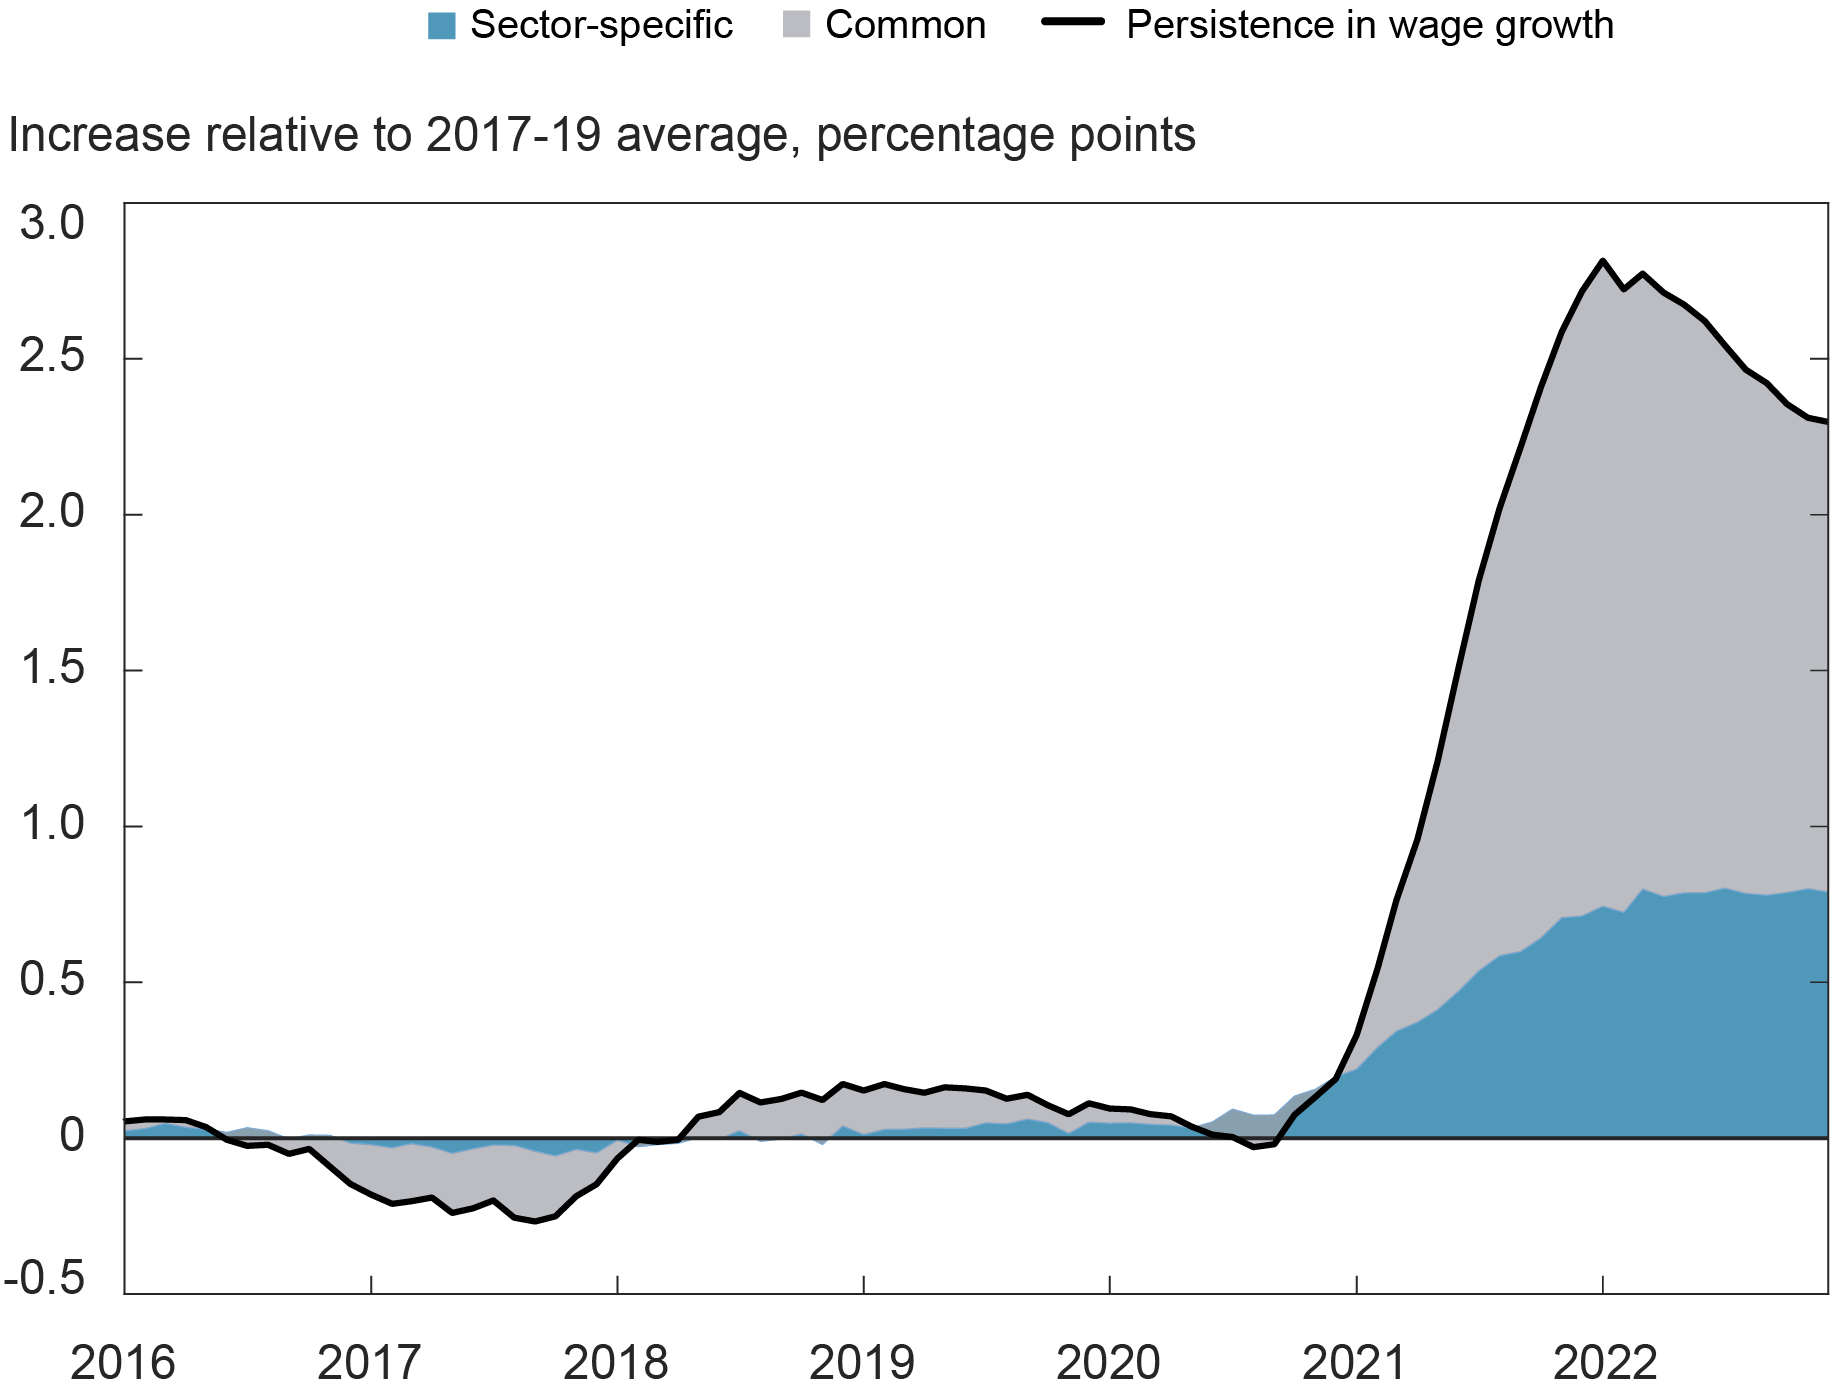
The increase in trend wage growth witnessed in 2021 is clearly driven by the common component, which accounts for more than two-third of the increase. The deceleration in trend wage growth taking place over 2022 is also entirely driven by the same common component. Looking ahead, it is unclear whether the common trend component of wage growth will keep decreasing, because the estimates for late 2022 suggest that the pace of this decline has slowed. Adding to this concern, the sum of the sector-specific trend components (the blue area in the chart above) has also plateaued in the last year and has not shown signs of reversal yet.
What Are the Implications of Persistent Wage Growth?
Despite the very obvious benefits of wage growth, the persistence of the recent increase in wage growth is potentially cause for concern because it may become incompatible with price stability. Wage growth is often thought to feed back into price hikes in labor-intensive sectors, and this pass-through may have increased during the pandemic. In the chart below, we inspect how the trend in wage growth relates to the trend in price inflation in core services (excluding housing) recovered from PCE data. Both trends are estimated using the methodology described earlier, so their timing can be compared as they are both expressed in terms of annualized monthly growth.
Persistence in Wage Growth and Services Inflation
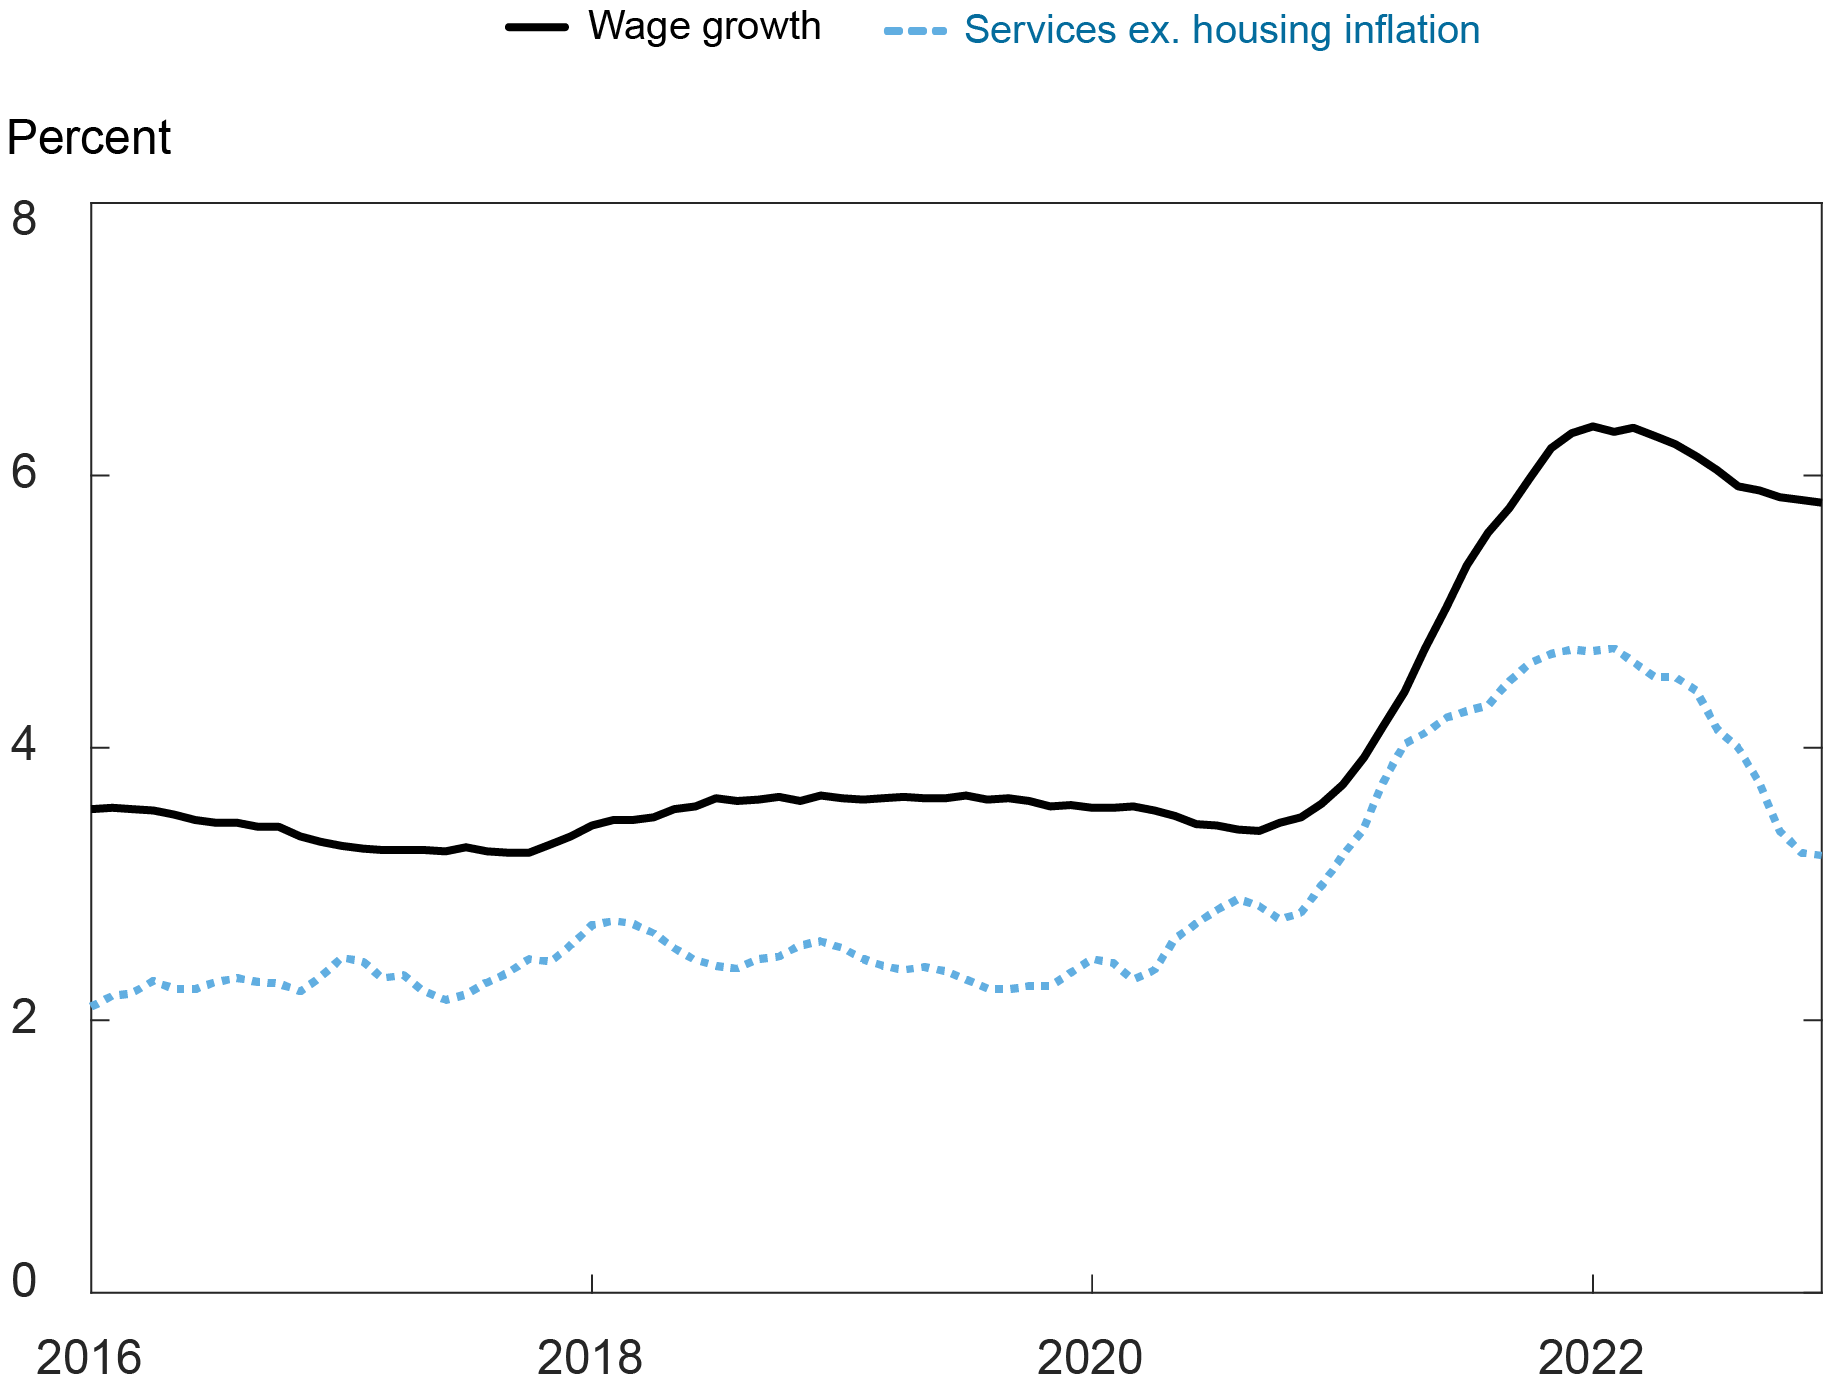
Interestingly, our results not only suggest that the persistent component of core services inflation started to increase before trend wage growth did, but also show that it has come down faster, despite the fact that both trends peaked around the beginning of 2022. Persistent services inflation markedly slowed down between June and October, although it seems to have levelled off since. A further deceleration in trend wage growth may ease inflationary pressures, but considerable uncertainty about the speed of this decline remains.

Martín Almuzara is a research economist in Macroeconomic and Monetary Studies in the Federal Reserve Bank of New York’s Research and Statistics Group.

Richard Audoly is a research economist in Labor and Product Market Studies in the Federal Reserve Bank of New York’s Research and Statistics Group.

Davide Melcangi is a research economist in Labor and Product Market Studies in the Federal Reserve Bank of New York’s Research and Statistics Group.
How to cite this post:
Martin Almuzara, Richard Audoly, and Davide Melcangi, “A Turning Point in Wage Growth?,” Federal Reserve Bank of New York Liberty Street Economics, February 23, 2023, https://libertystreeteconomics.newyorkfed.org/2023/02/a-turning-point-in-wage-growth/
BibTeX: View |


Disclaimer
The views expressed in this post are those of the author(s) and do not necessarily reflect the position of the Federal Reserve Bank of New York or the Federal Reserve System. Any errors or omissions are the responsibility of the author(s).
 RSS Feed
 Follow Liberty Street Economics