


In a recent post, we introduced the Multivariate Core Trend (MCT), a measure of inflation persistence in the core sectors of the personal consumption expenditure (PCE) price index. With data up to February 2022, we used the MCT to interpret the nature of post-pandemic price spikes, arguing that inflation dynamics were dominated by a persistent component largely common across sectors, which we estimated at around 5 percent. Indeed, over the year, inflation proved to be persistent and broad based, and core PCE inflation is likely to end 2022 near 5 percent. So, what is the MCT telling us today? In this post, we extend our analysis to data through November 2022 and detect signs of a decline in the persistent component of inflation in recent data. We then dissect the layers of inflation persistence to fully understand that decline.
Our results are consistent with the “onion” metaphor (see this speech by New York Fed President John Williams) that identifies the three important layers of inflation as core goods, core services ex-housing, and housing, while noncore sectors (food and energy) represent the outer layer of the inflation onion. In our analysis, however, while the housing sector clearly stands apart, the differences between the recent evolution of core goods and that of services ex-housing are smaller and subtler.
The MCT Today
We begin by displaying our MCT estimates (blue line) alongside twelve-month headline and core PCE inflation in the chart below. The shaded area is a 68 percent probability band. Our estimates tell the following story for 2022: After remaining stable at 5 percent from January to July, the trend declined to 4.7 in August, 4.5 in September and 3.9 in October. Through November, the MCT stands at 3.7 percent with a 68 percent probability interval of (3.1, 4.3). Underlying this evolution, there are important differences across sectors and between common versus sector-specific components, as we explain below.
PCE and Multivariate Core Trend
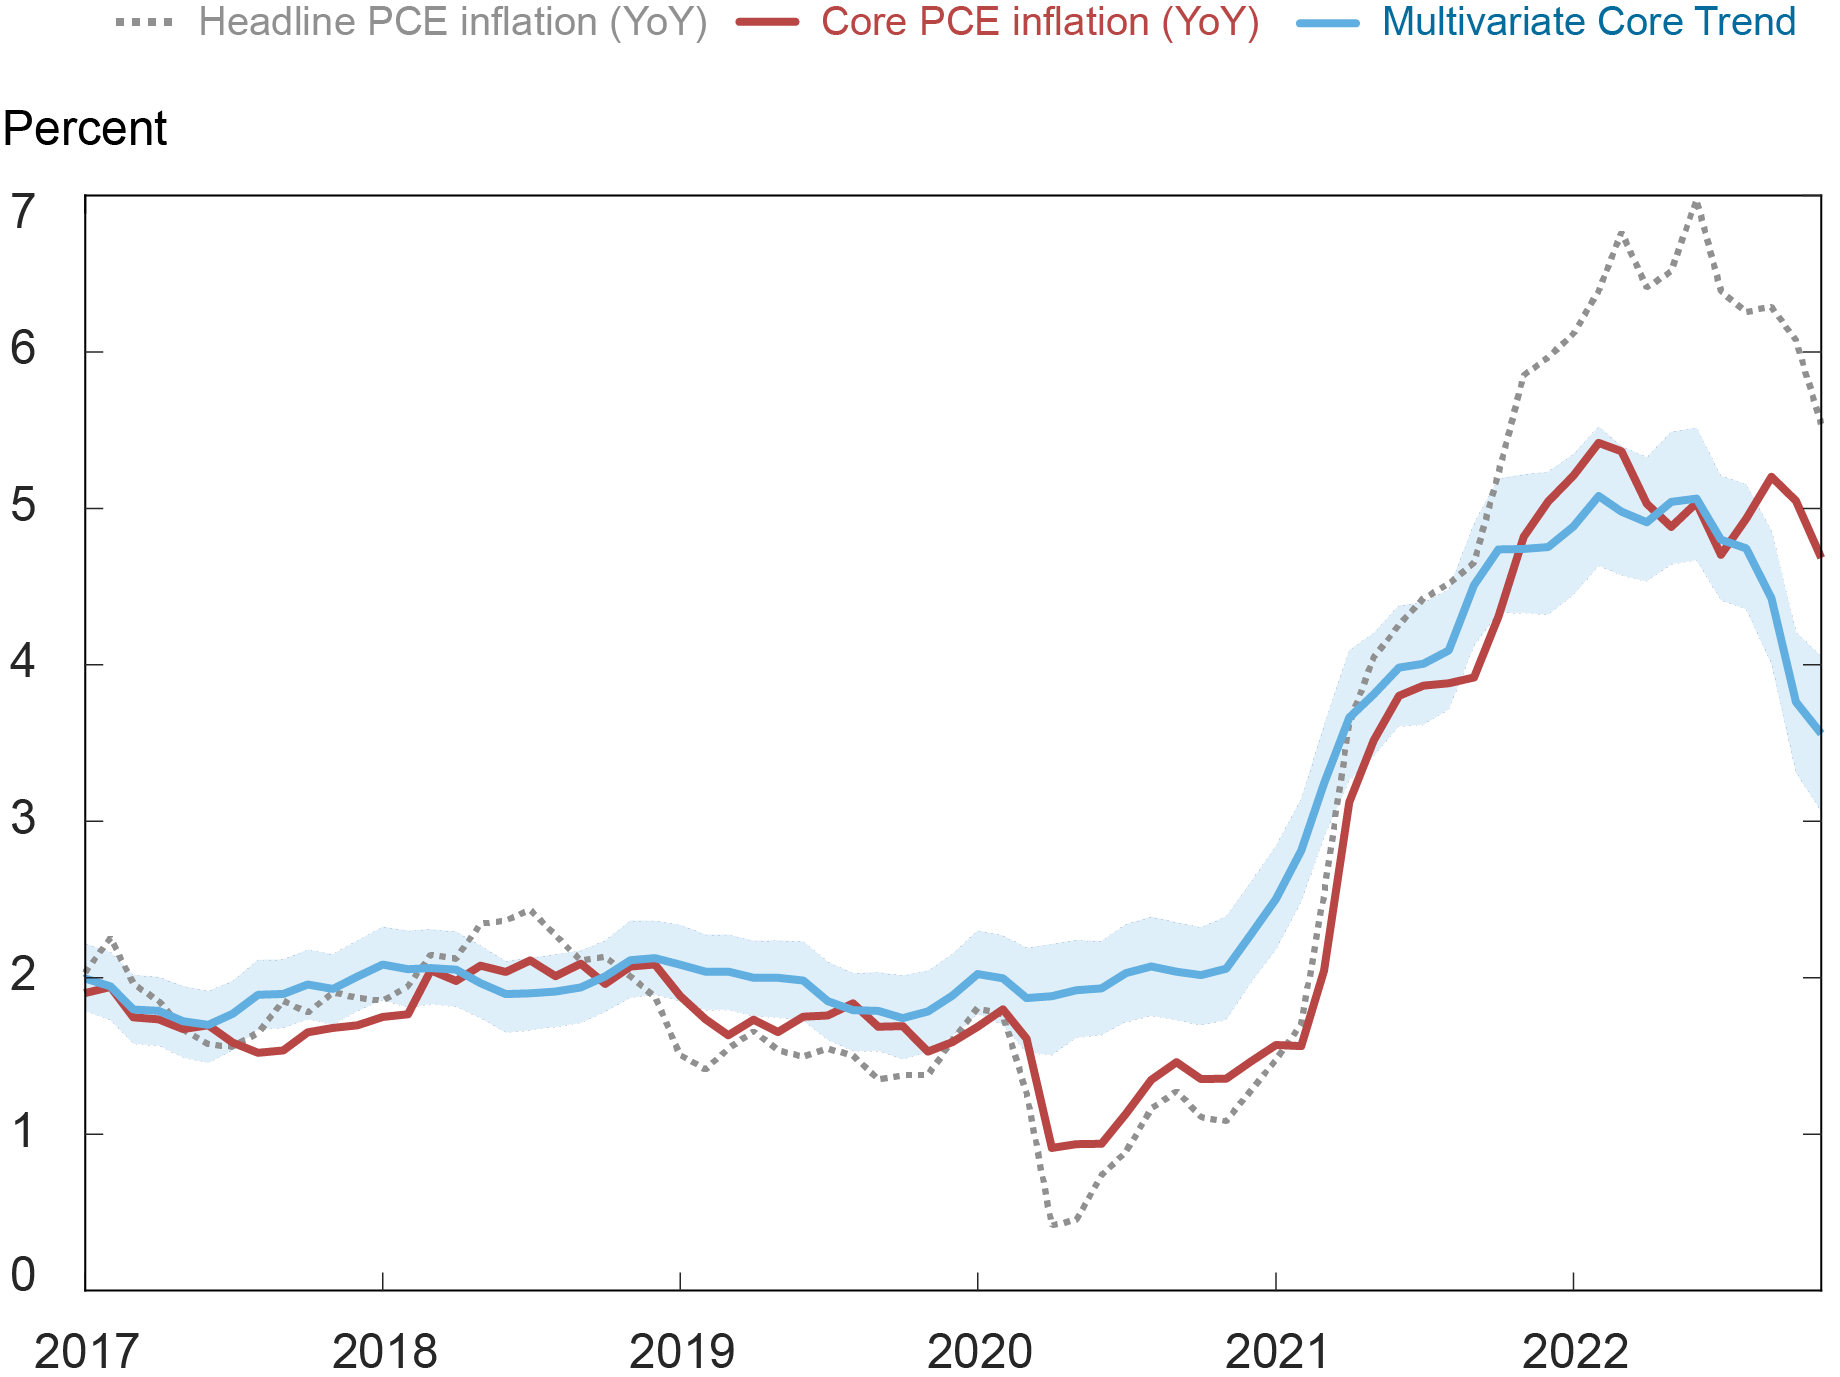
Note: The shaded area is a 68 percent probability band.
First, it is worth noting that the twelve-month rate of core PCE inflation now lies well above the trend and, in fact, above the upper end of the probability band. One reason is that even core sectors have transitory components and outliers that may push core inflation up or down, and the MCT seeks to filter those out (see our previous post for more detail). Another reason is that the twelve-month measure gives too much weight to data a year old and is therefore more backward-looking than the MCT. Hence, the MCT better reflects the current state of inflation persistence in times of shifts in the inflation process.
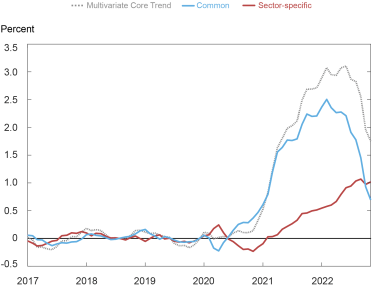
Inflation persistence has continued to be broad-based over the year, with most of the trend coming from a common component. The next chart decomposes the increase in trend relative to the pre-pandemic average (dashed line) into a common component (blue line) and a sector-specific component (red line). The common trend appears to have peaked sometime early in 2022, based on the point estimates. However, the decline of the overall trend is delayed because of the upsurge of a strong sector-specific trend that reached its maximum in September and has hovered around it since. Where is it coming from?
Inflation Trend Decomposition: Common vs Sector-Specific
Peeling the Inflation Persistence Onion
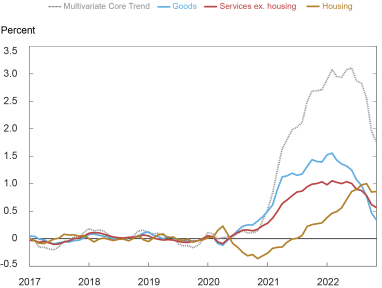
The chart below shows a sectoral decomposition of the increase in inflation from its pre-pandemic average. Given the prominence of housing, we decompose the core services sector into housing
ex-utilities (in other words, rents and owner-equivalent rents) and services ex-housing. The increase in inflation trend in these two sectors, together with that in core goods, add up to the total change
in MCT.
The chart shows that the persistent component of housing represents a fair amount of the overall increase in trend, comparable to the contribution of core goods and core services ex-housing. To be precise, the trend in core goods (blue line) was 0.9 percent in November 2022 compared to -0.4 percent pre-pandemic, contributing 0.3 percentage points (pp) of the 1.8 pp increase in the MCT; the trend in core services ex-housing (red line) went from 2.4 percent to 3.5 percent, contributing 0.6 pp; finally, the trend in housing (gold line) went from 3.4 percent pre-pandemic to 8.4 percent, contributing 0.9 pp. The chart also shows that the dynamics of core goods and core services ex-housing were similar, with housing standing apart. Housing had a negative contribution to trend in the second half of 2020, rising steadily through 2021 and 2022 without any clear sign of abating.
Inflation Trend Decomposition: Sector Aggregates
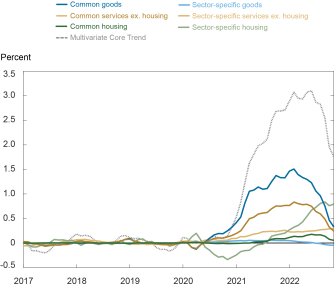
The similarity between the housing trend in the chart above and the sector-specific trend in the previous chart is not a coincidence. The chart below further splits sectoral trends into common and sector-specific sectoral trends. It shows that the common persistence is attributed in roughly equal parts to goods and services ex-housing, in contrast to housing, which is dominated by sector-specific variation. We further see that while the common trend has declined since early 2022, the sector-specific trend, again almost entirely driven by housing, has continued to increase, only tentatively flattening in the last two months. In other words, when dissecting the MCT, the trends in core goods and core services ex-housing do not appear very different, while housing behaves as a separate layer.
Finer Inflation Trend Decomposition
Dissecting the sectoral aggregates more finely, we find the following:
- All durables and core nondurables present a pattern similar to that of the aggregate goods sector—in other words, the trend is broad-based and there is little or no contribution from sector-specific persistent shocks.
- There is more heterogeneity among core services ex-housing, with a few sectors having independent dynamics (for example, the trend in health care inflation is flat and largely sector-specific, while the trend in financial services has been declining since the onset of the pandemic).
- The most important service categories (such as transportation, recreation, and food services and accommodation) show a pattern of trend inflation similar to that of core goods, with the incidence of the common trend growing rapidly through mid-2022. That the share of these sectors is large explains why goods and services ex-housing have so much in common.
- Finally, as mentioned before, housing stands apart.
Discussion and Concluding Remarks
To sum up, we find evidence of a decline in the size of the persistent component of core PCE inflation starting in September 2022. The decline follows a long period of high and essentially constant inflation persistence. Dissecting the layers of aggregate inflation provides further insights: core goods and core services ex-housing have been moderating since early 2022, reflecting the evolution of the common component, while housing has continued to move up, driven by its own sector-specific trend. This is evocative of the onion metaphor used by President Williams and the analysis cited by Chair Powell.
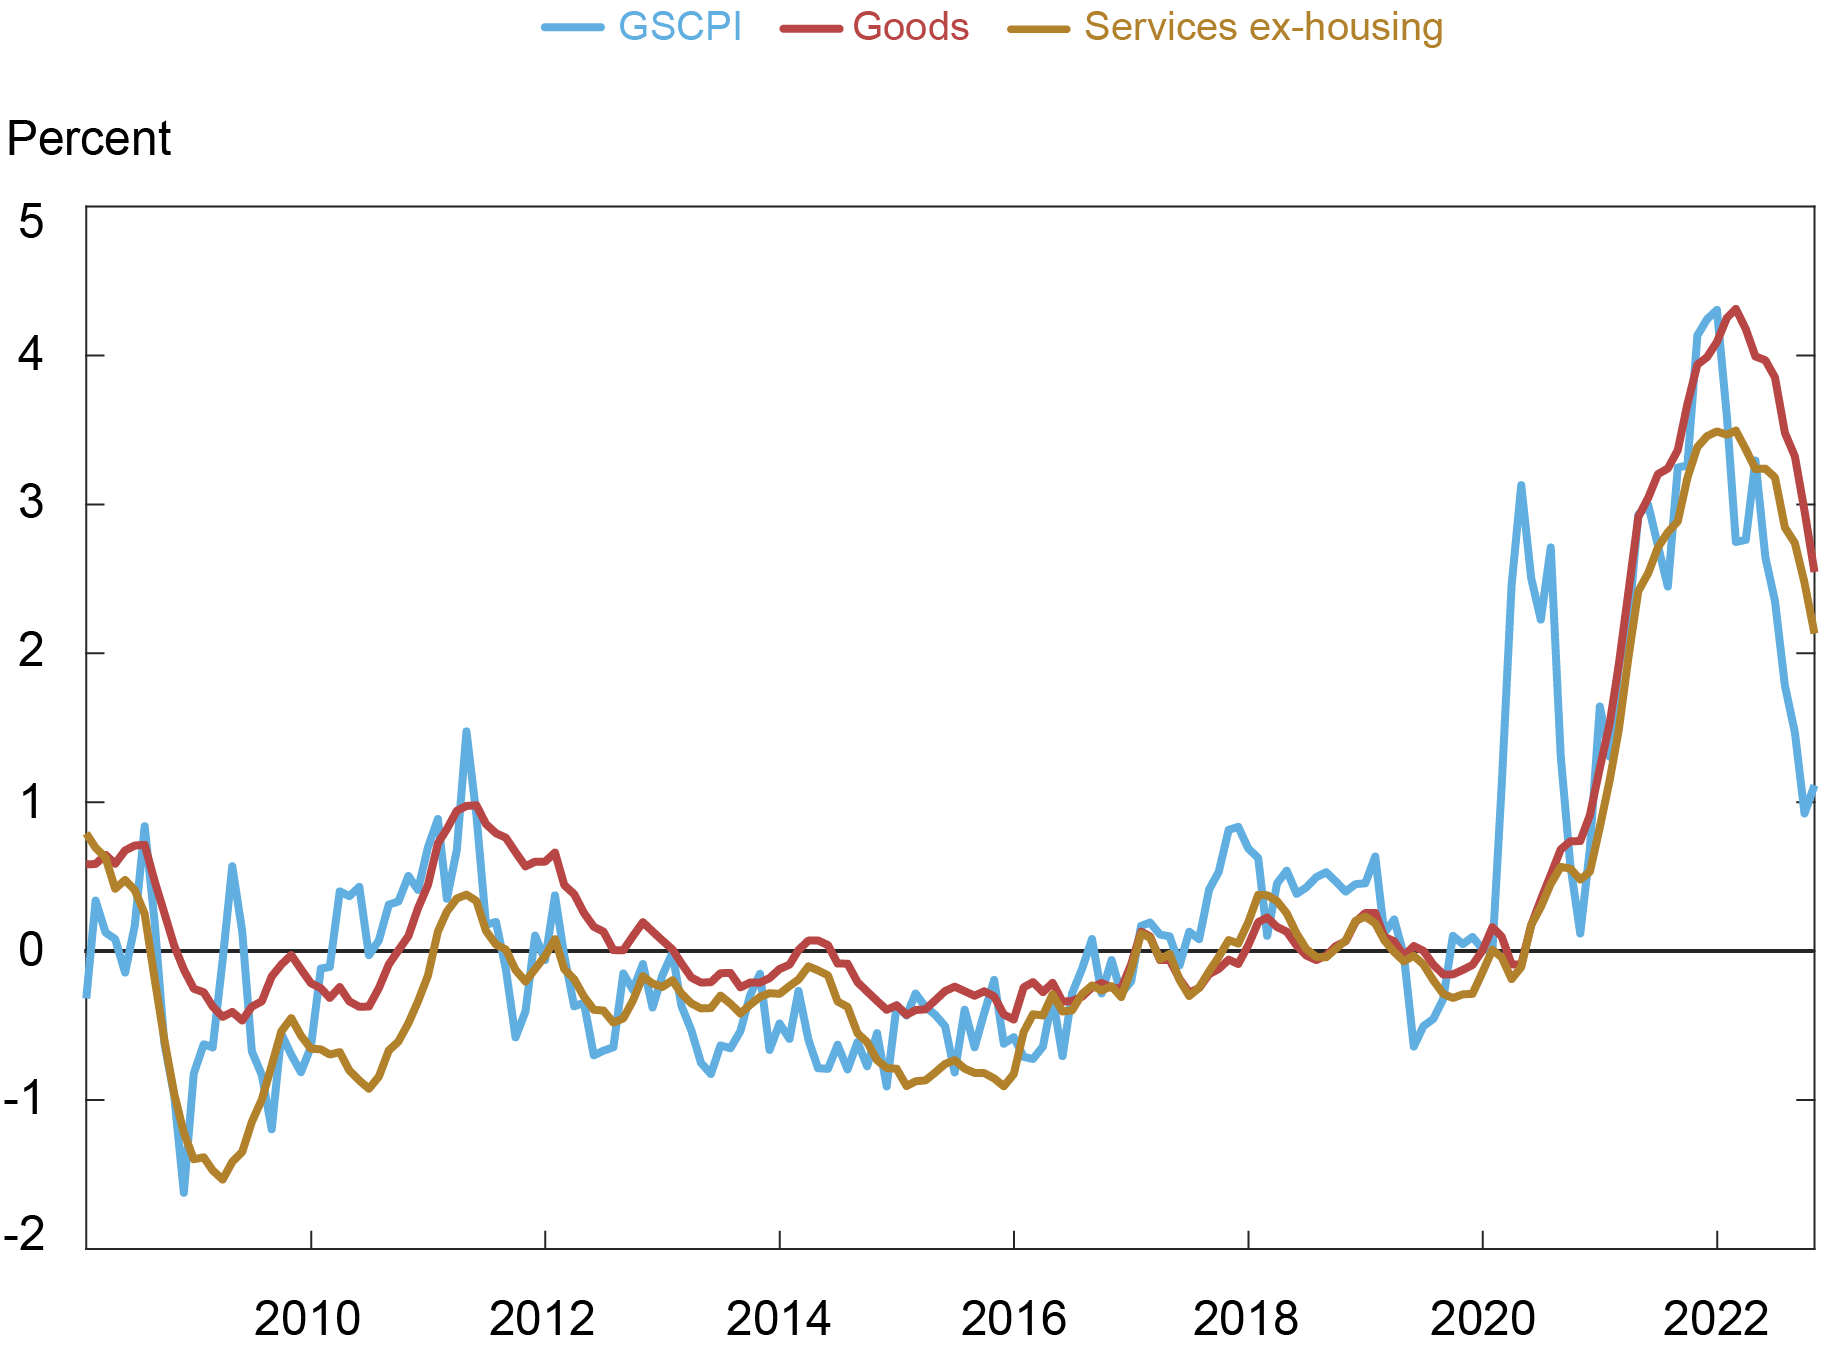
The natural question is what underlies the recent movements. Answering this is challenging, but one suggestive (yet reduced-form) piece of evidence is given in the next chart. It shows core goods and core services ex-housing together with the Global Supply Chain Pressure Index (GSCPI) constructed by our New York Fed colleagues (all variables are relative to their pre-pandemic level and scaled to have unit standard deviation). Pandemic-related supply chain disruptions have long been identified as a primary contributor to goods inflation and the chart suggests that spikes in the GSCPI often coincide with spikes in the trend in goods inflation. The GSCPI also appears to be a reasonable predictor of shifts in the trend in services ex-housing inflation, although the association is somewhat weaker.
Multivariate Core Trend and Supply Chains
To conclude, however, while recent developments are in the right direction, the MCT is still way above its pre-pandemic level and consequently well above a level consistent with price stability.

Martín Almuzara is a research economist in Macroeconomic and Monetary Studies in the Federal Reserve Bank of New York’s Research and Statistics Group.

Marek Jarocinski is an economist in the Monetary Policy Research Division at the European Central Bank. He is currently on secondment at the Federal Reserve Bank of New York.

Argia Sbordone is the head of Macroeconomic and Monetary Studies in the Federal Reserve Bank of New York’s Research and Statistics Group.
How to cite this post:
Martín Almuzara, Marek Jarocinski, and Argia Sbordone, “The Layers of Inflation Persistence,” Federal Reserve Bank of New York Liberty Street Economics, January 5, 2023, https://libertystreeteconomics.newyorkfed.org/2023/01/the-layers-of-inflation-persistence/
BibTeX: View |


Disclaimer
The views expressed in this post are those of the author(s) and do not necessarily reflect the position of the Federal Reserve Bank of New York or the Federal Reserve System. Any errors or omissions are the responsibility of the author(s).
 RSS Feed
 Follow Liberty Street Economics
Thank you for your incredible work and thought that went into this? So if one is using the MCT y-o-y of 3.7% in November when the fund rate was 4.0% the real funds rate was essentially flat (+0.3% with a range of -0.3%, +0.9%). With the recent move to 4.5% funds rate, unless MCT growth has slipped significantly further, would you agree that monetary policy is not yet restrictive? The challenge, in my opinion, has been to determine what the real funds rate actually is, since it depends on which inflation measure is used. Your work is very helpful in this way.