


In a January 2022 post, we first presented the Global Supply Chain Pressure Index (GSCPI), a parsimonious global measure designed to capture supply chain disruptions using a range of indicators. In this post, we review GSCPI readings through December 2022, and then briefly discuss the drivers of recent moves in the index. While supply chain disruptions have significantly diminished over the course of 2022, the reversion of the index toward a normal historical range has paused over the past three months. Our analysis attributes the recent pause largely to the pandemic in China amid an easing of “Zero COVID” policies.
Updated GSCPI
The GSCPI peaked at 4.3 standard deviations above its historical mean at the end of 2021, after which it declined substantially. The initial period of decline saw it drop to 2.8 by March 2022, after which it temporarily increased in April, primarily due to pandemic lockdowns in China and the Russia-Ukraine war. The GSCPI then experienced five consecutive months of declines, reaching a low of 0.9 in September. However, the past three months have witnessed a pause in the reversion to the historical average, with the index increasing by a total of 0.29 points in October and November before declining by 0.05 points last month, leaving the total three-month increase at about a quarter point. Synchronously, we have seen a worsening COVID situation in China. The goal of this post is to examine how much of the resurgent upward supply chain pressures can be attributed to China’s evolving policies in response to the current outbreak.
Global Supply Chain Pressure Index Returning to Historical Average on Pause
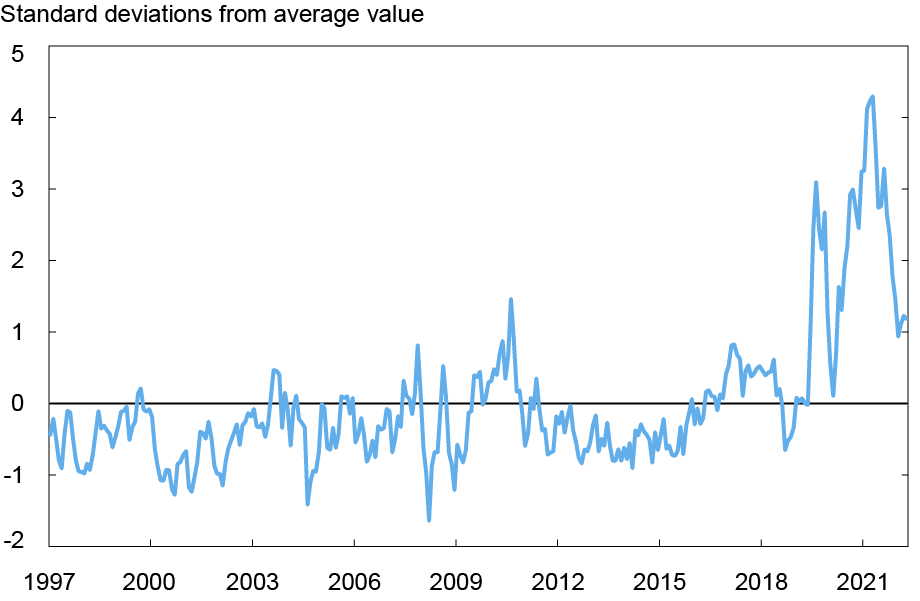
Note: Each index is scaled by its standard deviation; GDP Weighted Supply Chain Pressure Index is constructed by aggregating USA, GBR, EA, CHN, JPN, TWN, KOR supply chain pressure indices via GDP weights.
Methodology
Before analyzing this recent pickup in supply chain pressures, we remind readers that the GSCPI is based on two sets of data. Global transportation costs are measured by using data on ocean shipping costs, for which we employ data from the Baltic Dry Index (BDI) and the Harpex index, as well as BLS airfreight cost indices for freight flights between Asia, Europe, and the United States. We also use supply chain-related components of Purchase Manager Index (PMI) surveys—“delivery times,” “backlogs,” and “purchased stocks”—for manufacturing firms across seven interconnected economies: China, the euro area, Japan, South Korea, Taiwan, the United Kingdom, and the United States. Before combining these data within the GSCPI by means of principal component analysis, we filter out demand effects from the underlying series by regressing the PMI supply chain components on the “new orders” components of the corresponding PMI surveys and, in a similar vein, regressing the global transportation cost measures onto GDP-weighted “new orders” and “inputs purchased” components across the seven PMI surveys.
China’s Contribution
In the following chart we analyze China’s contributions to the GSCPI by combining all underlying variables most directly related to China’s supply chain conditions and comparing the contribution of these “China factors” to the influence of the remaining underlying variables. Over the course of the pandemic, China’s contributions to the GSCPI were generally small or negative, with significant exceptions for large positive contributions in February 2020, April 2022, and the two recent data releases for October and November 2022. (A large positive Chinese contribution in August 2021 was almost entirely driven by a very large, temporary spike in the Asia outbound air freight index which may not have been related to China supply conditions).
China’s large positive contributions were generally followed by tightening supply conditions in the rest of the world. A novel aspect of the most recent developments is that Chinese conditions appear more divergent from global supply conditions. One possible interpretation is that China’s new wave of COVID has limited spillovers to developed countries where vaccination rates are higher and lockdown measures are less severe.
The Chinese contribution declined to about zero in December, which was consistent with a modest improvement that was shown in supply delivery times in the S&P Global/Caixin PMI index, which is used in construction of the GSCPI. However, an alternative PMI index published by China’s National Bureau of Statistics, which uses a different survey sample than the private Caixin index, showed a very large worsening of supplier delivery times. This divergence between the two indices raises an important watchpoint as to the direction of China’s contribution to the GSCPI in coming months.
GSCPI Pressures During Entire Pandemic
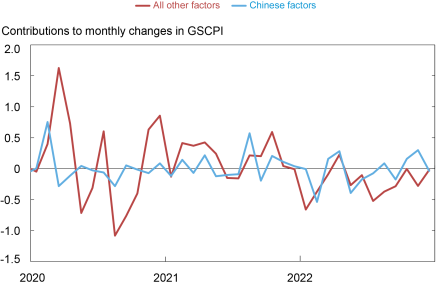
Note: Positive values indicate tightening supply chain conditions while negative values indicate loosening conditions. Chinese factors is defined as Chinese delivery times, backlogs, purchased stocks, and Asia Inbound/Outbound air freight costs.
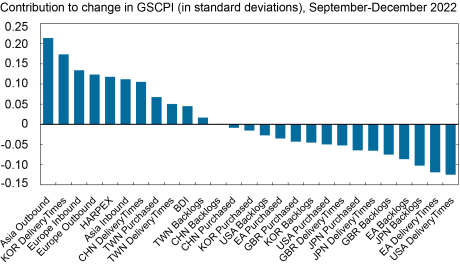
To further assess these divergent trends, we illustrate how each of the underlying variables contributed to the overall change in the GSCPI in the last three months. Each column represents the contribution, in standard deviations, of each component of our index to the overall change in the index during a given period. Over the past three months, the largest contributing factors to increasing supply chain pressures were Asia outbound air freight costs and Korean delivery times. These contributions were partially offset by improvements in sectors such as U.S. and euro area delivery times. The sum of all positive components increased the GSCPI by 1.16 standard deviations while the negative components decreased it by 0.92 standard deviations, resulting in a 0.24 three-month change in the GSCPI.
In December 2022 We Observe Divergent Trends in Supply Chain Conditions
Chinese Factor Counterfactual
We run two counterfactual exercises to understand the magnitude of recent developments in China on the GSCPI. In the first exercise, we assume Chinese factors contribute zero to the last three months of the GSCPI. In the second, we assume that Chinese factors contribute values identical to their September levels. The results of these exercises are that GSCPI would have been .03 higher or .17 lower, respectively, from its September levels rather than the current .24 higher. Because Chinese factors improved the GSCPI in September (that is, reduced the index), the September contributions counterfactual is lower than the zero contributions counterfactual. Overall, our simple analysis suggests that the direct impact of recent movements of Chinese indicators is limited but has caused a pause in the improvement in the GSCPI.
Global Supply Chain Pressure Index: Chinese Factor Contributions Counterfactual
Chinese factors set to true values, zero, and September values
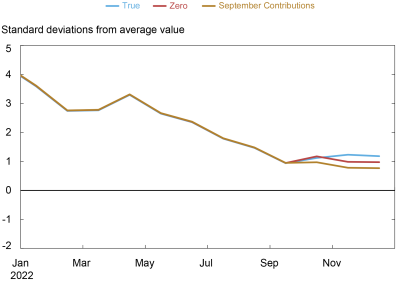
Note: Each index is scaled by its standard deviation; GDP Weighted Supply Chain Pressure Index is constructed by aggregating USA, GBR, EA, CHN, JPN, TWN, KOR suppply chain pressure indices via GDP weights. Chinese factors is defined as Chinese delivery times, backlogs, purchased stocks, and Asia Inbound/Outbound air freight costs.
Conclusions
In this post, we provide an update of the GSCPI through December 2022. After analyzing the contributions of the underlying variables in the index, we can partly attribute the recent slowdown of the GSCPI’s return to its historical average to worsening supply conditions in China, which have also spilled over into its neighboring trade partners. In this context, it will be interesting to see how future GSCPI readings evolve in light of the recent relaxation of China’s pandemic restrictions and resulting wave of COVID-19 infections, hospitalizations, and deaths.

Gianluca Benigno is the head of International Studies in the Federal Reserve Bank of New York’s Research and Statistics Group.

Hunter L. Clark is an international policy advisor in International Studies in the Federal Reserve Bank of New York’s Research and Statistics Group.

William Cross-Bermingham is a research analyst in the Federal Reserve Bank of New York’s Research and Statistics Group.

Ethan Nourbash is a research analyst in the Federal Reserve Bank of New York’s Research and Statistics Group.
How to cite this post:
Ozge Akinci, Gianluca Benigno, Hunter Clark, William Cross-Bermingham, and Ethan Nourbash , “Global Supply Chain Pressure Index: The China Factor,” Federal Reserve Bank of New York Liberty Street Economics, January 6, 2023, https://libertystreeteconomics.newyorkfed.org/2023/01/global-supply-chain-pressure-index-the-china-factor/
BibTeX: View |


Disclaimer
The views expressed in this post are those of the author(s) and do not necessarily reflect the position of the Federal Reserve Bank of New York or the Federal Reserve System. Any errors or omissions are the responsibility of the author(s).
 RSS Feed
 Follow Liberty Street Economics