


Annual CPI inflation reached 9.1 percent in June 2022, the highest reading since November 1981. The broad-based nature of the recent inflation readings has increased concerns that inflation may run above the Federal Reserve’s target for a longer period than anticipated. In this post we use detailed industry-level data to examine two prominent cost-push-based explanations for high inflation: rising import prices and higher labor costs. We find that the pass-through of wages and input prices to the U.S. Producer Price Index has grown during the pandemic. Both the large changes in these costs and a higher pass-through into domestic prices have contributed toward higher inflation.
Aggregate Facts
We plot the evolution of the core cumulative consumer price index (core CPI) in the United States starting from the business cycle trough, as defined by the peak unemployment rate, for each of the past six economic expansions for core goods inflation and core services inflation in the chart below. The pick-up in core goods inflation in the current expansion is the strongest across all expansions since the 1970s. In the post-COVID period, goods prices have risen by 16 percent within only eight quarters since the unemployment peak. The pick-up in service prices is more modest, but has accelerated recently. The strong growth in goods versus services prices over most of the recent period is a reversal of the typical inflation dynamics over the last twenty years, which, as shown in earlier work, were characterized by firming up of services prices and essentially no pick-up in goods prices despite robust recoveries in unemployment. On the contrary, goods inflation picked up briskly in 2021 and far exceeded services inflation.
Core Goods and Core Services Prices Have Risen Sharply
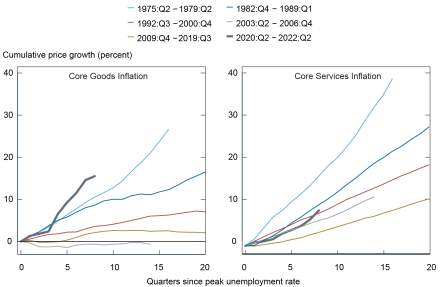
Notes: The left panel plots the cumulative core goods CPI inflation (All items less food and energy, seasonally adjusted) against time, starting at the quarter of peak unemployment of a given recession. The right panel plots the cumulative core services inflation (All items less energy services) against time.
Two important factors that could drive the high inflation rate in the current era are rising import prices due to supply chain bottlenecks and strong wage growth, both in the goods and in services sectors. We next provide several charts that illustrate these trends.
The left panel of the chart below plots the price index of U.S. import prices by end-use category, normalized to 100 in February 2020. The chart illustrates that the import prices of all categories have picked up, leading to a rise in average import prices by more than 10 percent since early 2020. Import prices affect U.S. inflation both because imports are used as inputs in domestic production and because foreign firms directly compete with U.S. firms in final goods markets. The chart highlights that both foreign input and output prices have increased. Import prices have risen by nearly 50 percent for industrial supplies and materials since early 2020. These products are used as inputs in a broad range of industries. Prices of final consumer goods and capital goods have also grown throughout 2021, but are currently only about 3 percent higher than at the beginning of the COVID pandemic.
The right panel of the chart shows weekly nominal wages from the BLS, separately for goods-producing and services-providing workers, indexed to the first quarter of 2020. The chart highlights that nominal wage growth has accelerated in the recent period, in particular in service-providing industries.
Import Prices and Wages Have Grown Significantly

Notes: The left panel plots import prices by end-use category from January 2014 to May 2022. The import price indexes are all indexed to 100 in February 2020 to coincide with the beginning of COVID-19 in the U.S. We exclude fuels because they are generally highly volatile. The share of each category of total imports in 2017 were: foods, feeds, and beverages comprise 6%, industrial supplies and materials 14%, capital goods 30%, autos, parts, and engines 17%, and consumer goods 28%. The right panel shows nominal weekly wages for services-providing and goods-producing workers, indexed to 2020:Q1.
What is causing these wage pressures? Recent work suggests a tight labor market as one of the main drivers. The next chart plots the time series of the Employment Cost Index (ECI) against the vacancy-to-hires ratio, which we use to proxy for the tightness of the labor market, in the manufacturing sector (left panel) and in the services sector (right panel). The ECI is a better measure of compensation growth than weekly wages because it accounts for shifts in industry and occupational composition of the workforce, and it includes benefits. The charts point to a strong relationship between labor market tightness and compensation growth in both the manufacturing and services sectors.
Compensation Growth is Correlated with Labor Market Tightness
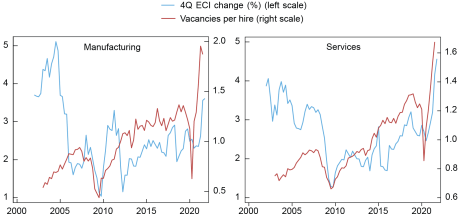
Notes: Vacancies per hire is calculated using JOLTS vacancies and hires. The four-quarter percent change in ECI is obtained from the total compensation employment cost index for private industry workers in the corresponding sector.
Methodology
We now investigate how the changes in import prices and wages we have documented can affect U.S. domestic prices. We draw on a 2019 study that showed that changes in import prices can affect firms’ prices via two channels: (i) strategic complementarities and (ii) marginal cost. The first channel captures how much domestic firms adjust their prices in response to changes in the prices charged by their domestic competitors. For example, if the price of imported cars increases, domestic car producers can also increase their prices. The marginal cost channel captures how much domestic prices change in response to changes in input costs. These are affected by both intermediate inputs, either imported or domestic, and wages. For example, when the price of imported steel or the wage of production workers goes up, this affects the cost of producing cars, which feeds through to higher prices of domestically produced cars.
The 2019 study was able to isolate strategic complementarities and marginal cost using a rich firm-level data set for Belgium. We apply that framework to the U.S. economy using industry-level data, since firm-level U.S. data are unavailable to us. Even though we will not be able to establish a causal relationship, we nevertheless uncover some interesting correlations.
We use industry-level producer price indexes (PPI) as our measure of industry inflation because a clear mapping between international products and domestic industry categories is available for the PPI, but not for the consumer price index (CPI). The PPI measures the price received by domestic producers for their goods or services, comprising both final goods and intermediate goods. It is constructed by the U.S. Bureau of Labor Statistics (BLS) from a monthly survey of establishments representing nearly the entire goods sector. We construct an import price index for foreign competitors’ using disaggregated import data from the Census Bureau. We obtain an input price index for domestic and foreign inputs by applying the input-output matrix, from the Bureau of Economic Analysis (BEA), to import prices and domestic prices. We construct industry wages using average weekly earnings from the Quarterly Census of Employment and Wages (QCEW) from the BLS. Our analysis covers 341 “traded” industries (with positive imports in at least one year), mostly in manufacturing, and 192 “non-traded” industries, mostly in services, at the level of industry categories that are used to construct input-output tables by the BEA.
The Comovement of Domestic Prices, Import Prices, and Wages
We analyze the effects of rising input prices and wages on U.S. producer prices via the strategic complementarities and marginal cost channel using regression analysis. Since the correlation between import prices, wages, and domestic producer prices increased sharply in 2021, we allow the pass-through to differ relative to the earlier period of 2013-20 by including an interaction effect for 2021. In the table below, we illustrate our results by considering how prices in the United States would be affected if competitors’ prices, input prices, and wages were to rise by 10 percent, separately for traded and non-traded industries.
We begin by discussing the traded sector. First, we find that the strategic complementarity channel has significantly strengthened in 2021. For an industry with the average import share of 31 percent, a 10 percent increase in foreign competitors’ prices would normally lead to an increase in producer prices of about 0.5 percent between 2013 and 2020; whereas in 2021, it resulted in a producer price increase of 2 percent—4 times as large.
Second, we find positive and significant pass-through from input prices to industry prices. A 10 percent increase in input prices increased producer prices by 2.4 percent pre-2021 and 4 percent in 2021.
Third, we see that prior to 2021 pass-through from wages to producer prices was approximately zero in tradeable industries. This relationship has strenghthened significantly in 2021, when a 10 percent increase in wages was associated with a 1.4 percent rise in producer prices.
Pass-Through from Import Prices to Domestic PPI more than Doubled during COVID Period
| Effect of a 10 Percent Change in Strategic Complementarities, Input Prices, and Wages on PPI | Traded Industries (Percent) 2013-2020 | 2021 | Non-Traded Industries (Percent) 2013-2020 | 2021 |
|---|---|---|---|---|
| 1. Strategic complementarities channel (average share of imports = 0.31) | 0.54 | 2.04 | — | — |
| 2. Marginal cost channel | 2.47 | 5.32 | 1.63 | 3.41 |
| Input price channel | 2.36 | 3.95 | 0.94 | 0.98 |
| Wage channel | 0.11 | 1.37 | 0.69 | 2.43 |
| Total effect (row 1 + row 2) | 3.01 | 7.36 | 1.63 | 3.41 |
Summing across the three effects, we see that a 10 percent increase in import prices and wages is associated with a 7.4 percent increase in PPI in 2021, compared to only a 3 percent increase in the earlier period. Most of the effect (around 70 percent) flows through the marginal cost channel. The finding that the marginal cost channel dominates the strategic complementarities channel is consistent with other studies.
We next turn to the non-traded sector. By definition, the strategic complementarities channel is not active for non-traded industries since there are no foreign competitors. First, we find that a 10 percent increase in input prices increased producer prices by roughly 1 percent in 2021. In contrast to the traded sector, we do not find a significant pick-up in input price pass-through compared to the earlier period.
Second, similar to the traded sector, the relationship between wages and prices strengthened significantly in 2021 in non-tradebles. A 10 percent increase in wages is associated with a 2.4 percent rise in producer prices in 2021, compared to only 0.7 percent in prior years.
A caveat to our regression results is that they are subject to omitted variable bias (due to the lack of domestic competitors’ prices) and endogeneity of both input prices and wages. We are most concerned about the endogeneity of input prices, since both the left-hand side and the right-hand side of our regression contain domestic prices. We therefore perform an instrumental variables regression using imported input prices as an instrument for overall input prices, and find larger pass-through of input prices than in the baseline. This is consistent with prior work, where we instrumented for input prices with tariff changes in an earlier period and found that it produced larger pass-through.
Overall, our results indicate that imported input prices and wages have had a significant effect on U.S. domestic prices in recent months. This large effect stems both from their relatively larger increases and a higher pass-through rate. In addition, prices in the traded sector have become more correlated with foreign competitors’ prices, most likely because all firms are experiencing the same shocks.

Mary Amiti is the head of Labor and Product Market Studies in the Federal Reserve Bank of New York’s Research and Statistics Group.

Sebastian Heise is a research economist in Labor and Product Market Studies in the Federal Reserve Bank of New York’s Research and Statistics Group.
Fatih Karahan is a former economic research advisor in Labor and Product Market Studies in the Federal Reserve Bank of New York’s Research and Statistics Group.
Ayşegül Şahin is the Richard J. Gonzalez Regents Chair in Economics at the University of Texas at Austin.
How to cite this post:
Mary Amiti, Sebastian Heise, Fatih Karahan, and Ayşegül Şahin, “Pass‑Through of Wages and Import Prices Has Increased in the Post‑COVID Period,” Federal Reserve Bank of New York Liberty Street Economics, August 23, 2022, https://libertystreeteconomics.newyorkfed.org/2022/08/pass-through-of-wages-and-import-prices-has-increased-in-the-post-covid-period/
BibTeX: View |
Disclaimer
The views expressed in this post are those of the author(s) and do not necessarily reflect the position of the Federal Reserve Bank of New York or the Federal Reserve System. Any errors or omissions are the responsibility of the author(s).
 RSS Feed
 Follow Liberty Street Economics