


What factors are behind the recent inflation surge has been a huge topic of debate amongst academics and policymakers. We know that pandemic-related supply constraints such as labor shortages and supply chain bottlenecks have been key factors pushing inflation higher. These bottlenecks started with the pandemic (lockdowns, sick workers) and were made worse by the push arising from increased demand caused by very expansionary fiscal and monetary policy. Our analysis of the relative importance of supply-side versus demand-side factors finds 60 percent of U.S. inflation over the 2019-21 period was due to the jump in demand for goods while 40 percent owed to supply-side issues that magnified the impact of this higher demand.
The Debate
The U.S. has witnessed near historic inflation since the economy began to re-open in 2021 following the COVID-19 lockdowns, as seen in the chart below. There have been several factors put forth to explain this inflation outburst and its persistence, which have been difficult for policymakers to disentangle and have led to an active debate by leading economists. Some analysts have focused on the importance of supply chain constraints, while others point to demand as driving the jump in inflation. Meanwhile, some economists argue that a combination of supply and demand factors are necessary to generate the inflation we are currently witnessing. Our work belongs to the last camp.
Inflation has been very elevated
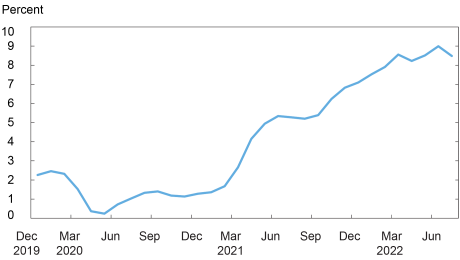
Notes: This chart plots the consumer price index (CPI) for all urban consumers (all items in U.S. city average). The monthly series represents the percentage change from a year ago and is not seasonally adjusted.
A Model-Based Approach
Arriving at a definitive understanding of the relative importance of demand and supply drivers of inflation is difficult without providing some formal structure that can be taken to the data. In the recent work referenced above, we take a step in this direction by building on the work of others to quantify the effects of the pandemic on inflation over the period spanning both the collapse and recovery phases of the economy. This framework not only allows us to examine the cumulative impact of the pandemic from 2019:Q4 to 2021:Q4, before the Russia-Ukraine war’s “energy/food shock” on inflation, but also to decompose the contribution of demand- and supply-side factors underlying the observed inflation.
The model allows for the observed limited factor mobility. That is, since everyone was exposed to the same health-related shock at a global level, it was difficult for firms to reallocate labor between sectors and/or switch and substitute suppliers in the short run, leading to shortages in labor and in other inputs. Furthermore, besides demand effects being present at the aggregate level—due to accommodative fiscal and monetary policy—the composition of demand also changed as consumers substituted from services to goods. The model incorporates these aggregate and sectoral demand effects, which can further amplify the impact of supply-side constraints on inflation due to the resulting supply-demand imbalances.
Taking the Model to the Data
We calibrate a closed-economy version of the model to match the observed U.S. inflation over the 2019-21 period, along with doing a similar exercise for the euro area. The model implies that inflation is a function of aggregate demand shocks, changes in hours worked, and productivity by sector. The changes in hours worked capture both demand and supply shocks, while changes in productivity/technology are sectoral supply shocks.
We assume that sector-level technological changes were zero over the 2019-21 period and use the observed inflation rate along with sectoral hours worked to back out the implied aggregate demand shock. The computed aggregate demand shock captures several possible demand drivers, such as changes in households’ preferences for consumption in the present vs. future as well as expansionary effects of fiscal and/or monetary policy.
Armed with the implied aggregate demand shock, the growth rates of sectoral hours worked, and the observed change in the composition of sectoral consumption (that is, an increase in consumption in the goods sector and a fall in consumption in the service sector), we then use the model structure to decompose the relative importance of supply and demand shocks in driving inflation. Crucially, the model structure allows us to explain why observed employment may have been below its “normal” level, and what sectoral dimensions of the data are crucial explaining this outcome—for example, a shortage of workers or a lack of demand given changes in preferences and/or the aggregate demand shift
U.S. Results
The first bar in the chart below presents our estimation of the U.S. CPI inflation rate over the 2019-21 period, which was calculated to be 9.18 percent from December 2019 to December 2021, annualized. The actual observed inflation during this period is 8.47 percent, so the model-calibrated rate is very close. The next three bars decompose the drivers of inflation. Notice that the sum of these bars is 10.5 percent, which is slightly higher given the nonlinear interactions between sixty-six sectors. The aggregate demand shock (“backed-out AD shock”) explains roughly 60 percent of model-based inflation. The remaining 40 percent of the model-based inflation is primarily explained by sectoral supply shocks (“sectoral supply shock”), while the change in households’ consumption patterns across sectors (“sectoral demand shock”) accounts for very little. The bottom line of this decomposition is that supply constraints magnified the impact of higher demand in inflation. Consequently, most sectors in the U.S.—fifty-eight out of sixty-six—were supply-constrained. This result is consistent with other research that shows that expansionary fiscal policy has increased the share of sectors classified as supply-constrained.
The model calibration shows the quantitative importance of both demand and supply shocks
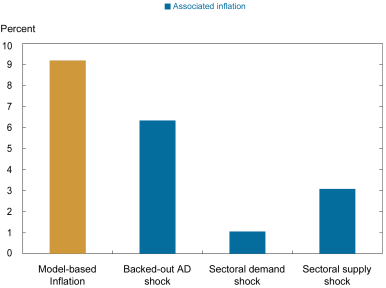
Notes: The chart presents a U.S. closed-economy inflation decomposition for a sixty-six sector economy, 2019-21. The first bar shows model-based inflation considering all shocks (demand and supply). The second bar considers the aggregate demand shift only. The third bar uses sectoral demand shocks only. Finally, the fourth bar uses sectoral supply shocks only.
Conclusions
The current debate on whether the Federal Reserve can engineer a soft landing needs to disentangle the drivers of U.S. inflation. Our work shows that inflation in the U.S. would have been 6 percent instead of 9 percent at the end of 2021 without supply bottlenecks. Our quantitative results clarify why some pundits were wrong to predict a transitory surge in inflation, while others were right in predicting high inflation, but for the wrong reasons. Put differently, fiscal stimulus and other aggregate demand factors would not have driven inflation this high without the pandemic-related supply constraints. In the absence of any new energy or other shock, it is therefore possible that the ongoing easing of supply bottlenecks will cause a substantial drop in inflation in the near term.

Julian di Giovanni is the head of Climate Risk Studies in the Federal Reserve Bank of New York’s Research and Statistics Group.
How to cite this post:
Julian di Giovanni, “How Much Did Supply Constraints Boost U.S. Inflation?,” Federal Reserve Bank of New York Liberty Street Economics, August 24, 2022, https://libertystreeteconomics.newyorkfed.org/2022/08/how-much-did-supply-constraints-boost-u-s-inflation/
BibTeX: View |
Disclaimer
The views expressed in this post are those of the author(s) and do not necessarily reflect the position of the Federal Reserve Bank of New York or the Federal Reserve System. Any errors or omissions are the responsibility of the author(s).
 RSS Feed
 Follow Liberty Street Economics
In reply to Daniel McLaughlin:
The Di Giovanni et al. paper cited in the post, “Global Supply Chain Pressures, International Trade, and Inflation,” covers the euro area analysis. Find it linked via the ECB Forum in the Related Reading section above. It was also published in the New York Fed Staff Reports series at: https://www.newyorkfed.org/research/staff_reports/sr1024.
The work focuses on decomposition of observed inflation. Very helpful indeed. I am also interested in implications of the work for Federal Reserve inflation fighting policy going forward in the face of weak GDP growth and accompanying recessionary fears resulting from current and anticipated future tightening.
I also wonder about the contribution to observed inflation resulting from long standing accommodative monetary policy in addition to expansionary pandemic fiscal policy.
Thank you.
I would be interested in your results for the euro area…have they been published?