


Congress passed the Community Reinvestment Act (CRA) in 1977 to encourage banks to meet the needs of borrowers in the areas in which they operate. In particular, the Act is focused on credit access to low- and moderate-income communities that had historically been subject to discriminatory practices like redlining.
In a recent staff report, we assess the impact of the CRA on household borrowing since 1999 using the New York Fed/Equifax Consumer Credit Panel (CCP). We do so with a variety of empirical methods to compare the borrowing of individuals in CRA-target areas to the borrowing of similar individuals in nontarget areas. Across a range of methods, we consistently find little to no impact of the CRA on household credit.
To better understand this result, we examine the mortgage issuance and discover that banks increase their market share in CRA-target areas by acquiring existing loans, allowing them to satisfy the CRA without impacting the overall supply of credit. This does not necessarily mean that the CRA is ineffective. For instance, the CRA also incentivizes the provision of credit to small businesses which we do not consider; however, our results suggest reforms that could increase the efficacy of the CRA to ensure access to credit for consumers.
What Does the CRA Do?
Depository institutions, which include commercial banks and thrifts, are subject to the requirements of the CRA. Other financial institutions such as independent mortgage banks, credit unions, and payday lenders are not covered. Depository institutions receive a CRA-compliance grade on a four-point scale as part of their regular supervisory examinations by the Board of Governors of the Federal Reserve System, the Federal Deposit Insurance Corporation, and the Office of the Comptroller of the Currency.
Bank CRA grades are determined jointly by banks’ lending, investments, and other services. But the grades place the greatest emphasis on lending. Historical compliance with the CRA is important to banks because it can impact the approval of new branches, acquisitions, and mergers. The scoring system ranges from “Outstanding” and “Satisfactory,” which are considered passing grades, to “Needs to Improve” and “Substantial Noncompliance,” which are failing grades. The vast majority of grades are passing scores (97 percent), with far more “Satisfactory” than “Outstanding” scores (82 percent vs. 15 percent).
A bank’s CRA assessment area typically encompasses the geographic areas where the bank has its main office, physical branches, and deposit-taking ATMs, as well as the surrounding geographies in which the institution conducted a substantial portion of its lending activity. Loans and other activities are CRA-eligible if they are made to low-to-moderate income (LMI) census tracts. For the purpose of the CRA, LMI tracts are precisely defined as having median family income of less than 80 percent of the surrounding geographic area median, typically a metropolitan statistical area (MSA). We will use the term MFI to refer to this median family income ratio.
Assessing the Impact on Households
The intricacies of the law’s implementation motivate the design of our analysis. Our primary approach compares individuals who live in census tracts with an MFI just below the 80 percent threshold to those who live in areas just above the cutoff. After controlling for income differences, we assume that these individuals are otherwise similar, differing only in CRA eligibility for the lending test. This approach is formally known as a regression discontinuity design (RDD).
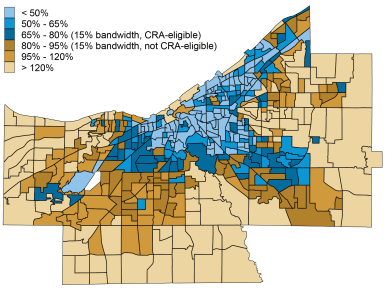
The chart below illustrates, for example, the distribution of MFI for census tracts in Cuyahoga County, Ohio, with CRA-eligible tracts shown in blue. We can see that there are many tracts that are within 15 percent of the 80 percent threshold that are just eligible (dark blue) and just ineligible (dark gold). These tracts tend to border each other and will be the primary point of comparison for our analysis.
Income and CRA-Eligibility in Cuyahoga County, Ohio
We measure consumer borrowing using a 2.5 percent representative sample of U.S. borrowers provided by the CCP. For the period 1997-2017, we compare debt balances of individuals in census tracts within a 15 percent bandwidth around the 80 percent eligibility cutoff while controlling for MFI and do not find a discontinuity in borrowing. The chart below illustrates this result using a binned scatter plot, which we confirm with formal regressions for total balances and other debt types such as mortgage, auto, and credit card.
Consumer Balances Are Smooth around the MFI Cutoff of 80 Percent
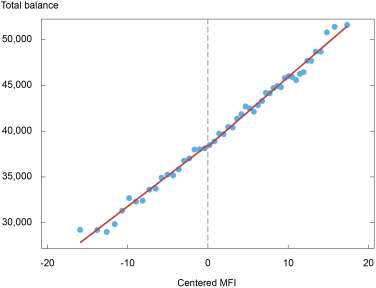
Notes: Total balances on the y-axis are in U.S. dollars. MFI is median family income ratio, defined as median family income as a percent of the surrounding geographic area median. The x-axis is centered at the 80 percent cutoff. Observations to the left of the cutoff are considered low-to-moderate income.
In addition to the RDD analysis, we consider neighboring census blocks, which are smaller geographic areas situated within census tracts. By comparing lending to geographically close individuals who live in adjacent blocks, but on the opposite sides of a tract CRA-eligibility border, we can control for unobservable factors that vary by geography. Consistent with the RDD result, we find no measurable difference between the borrowing activity of individuals who live just inside and just outside CRA-eligible tracts.
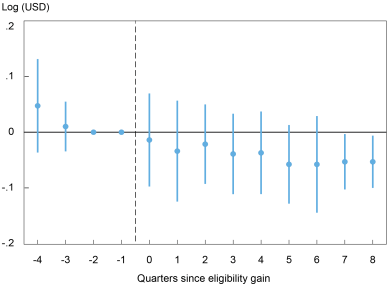
Finally, we exploit changes in LMI status and examine the evolution of borrowing activity by individuals in census tracts that become eligible for CRA oversight during our sample period. To account for differential trends in advance of an eligibility change, we control for time trends in tract income using the borrowing activity of neighbors. The chart below summarizes the average debt balances over time for a tract that gains eligibility relative to a tract that does not. Again, we do not find statistically significant evidence that debt balances increase after gaining CRA eligibility.
Consumers Don’t Increase Their Debt Balances after Becoming CRA-Eligible
Using each approach, we also consider the share of individuals with debt and several measures of credit risk—delinquencies, foreclosures, bankruptcies, and Equifax’s Risk Score. We do not find a material effect of the CRA on any of these outcomes.
Substitution of Mortgages from Nonbanks
The largest component of household borrowing are mortgages, making up more than 80 percent of overall consumer debt (excluding student loans). Hence, authorities pay particular attention to the mortgage originations of CRA-supervised banks. We use Home Mortgage Disclosure Act (HMDA) data, which include mortgage originations by bank and nonbank lenders that are not subject to CRA oversight. In the mortgage market, nonbanks are a significant source of mortgage originations.
We examine the identity of mortgage lenders in the HMDA data and find that banks in CRA-eligible tracts account for a greater share of mortgage lending because they purchase mortgages from other lenders. In concert with the lack of impact on balances, the mortgage origination and purchase results suggest that banks meet their CRA requirements in part by acquiring existing loans rather than originating new ones. This dynamic contributes to the lack of impact on overall consumer borrowing.
Takeaways
Using a wide range of methods, we fail to find a significant impact of the CRA on household borrowing during the 2000s. When examining the largest component of household borrowing, mortgages, we find evidence that CRA-supervised institutions (banks) purchase loans at a higher rate in these areas which helps them satisfy the CRA lending test but need not increase supply relative to other areas. Consumer lending is not the sole purpose of the CRA, as it seeks to encourage access to credit across many dimensions, not just to households. Moreover, we do not find evidence that eligible areas lack credit access.
Current efforts are underway to reform the CRA lending standards that are intended to ensure the program remains effective at achieving its goals of expanding credit to LMI communities. Our research suggests that the overall impact of the regulation is hampered by substitution from nonbanks that are unsupervised and highlights the challenges of regulatory frameworks that only apply to a subset of market participants.

Erica Bucchieri is a research analyst in the Federal Reserve Bank of New York’s Research and Statistics Group.
Jacob Conway is an economics Ph.D. candidate at Stanford University.
Jack Glaser is an economics Ph.D. candidate at the University of Chicago.

Matthew Plosser is a financial research advisor in Banking Studies in the Federal Reserve Bank of New York’s Research and Statistics Group.
How to cite this post:
Erica Bucchieri, Jacob Conway, Jack Glaser, and Matthew Plosser, “Does the CRA Increase Household Access to Credit?,” Federal Reserve Bank of New York Liberty Street Economics, February 27, 2023, https://libertystreeteconomics.newyorkfed.org/2023/02/does-the-cra-increase-household-access-to-credit/
BibTeX: View |

Disclaimer
The views expressed in this post are those of the author(s) and do not necessarily reflect the position of the Federal Reserve Bank of New York or the Federal Reserve System. Any errors or omissions are the responsibility of the author(s).
 RSS Feed
 Follow Liberty Street Economics
In reply to Jared Yarsevich:
Thank you for the thoughtful comment and questions. This is a great opportunity to clarify our analysis.
If there was no CRA and there was redlining, we would expect there to be a drop-off in lending in certain areas, but we would not expect that drop-off to occur precisely around the CRA-designated LMI 80% threshold. This would suggest that the discriminatory practices only occurred at this data cut-off. We agree that the smooth curve suggests that banks are lending to LMI geographies proportional to income, but the fact the curve does not shift here implies that the CRA may not be a key factor in those decisions.
The cut-off impacts bank decisions: we find that just below the cut-off the share of bank lending increases relative to nonbanks that are not subject to the CRA. However, this does not translate to the level of borrowing. The implication of our analysis is that without the CRA, the level of household borrowing would be the same.
With respect to the goals of the CRA, there are no precise metrics laid out in the law to be used as markers of its own efficacy. It may be that the CRA was not intended to increase borrowing in eligible areas. On the other hand, if the CRA did aim to increase credit supply in eligible areas, our analysis suggests the CRA may be more effective with modified evaluation criteria. In either case, the paper aims to provide additional data and analysis to inform the public on the impact of current CRA implementation.
Interesting work. Maybe I’m misreading the graph, but it seems to me that the smooth results you found in the regression discontinuity analysis are exactly what one would expect if the CRA is working. The premise of the CRA is that LMI geographies were previously neglected (redlined) by banks. If that neglect had continued, we would expect to see a large drop off to the left of the 0 midpoint on the graph. But we don’t see any drop off. Doesn’t the smooth curve you found indicate that banks are lending to LMI geographies proportionally to income? And doesn’t this fit the CRA objective of extending credit to LMI communities consistent with safe and sound banking practices? Were you expecting that lower income geographies would have higher debt balances than wealthier geographies just above the 80% AMI threshold? I don’t believe that was ever the goal of CRA. Am I fatally misunderstanding your analysis? Thank you for your thought-provoking work.