


As inflation has risen to forty-year highs, inflation inequality—disparities in the rates of inflation experienced by different demographic and economic groups– has become an increasingly important concern. In this three-part blog series, we revisit our main finding from June—that inflation inequality has increased across racial and ethnic groups—and provide estimates of differential inflation rates across groups based on income, education, age, and geographic location. We also use an updated methodology for computing inflation disparities by focusing on more disaggregated categories of spending, which corroborates our earlier findings and substantiates our conclusion that inflation inequality is a pronounced feature of the current inflationary episode.
In the first post of this series, we present disparities in inflation rates across racial and ethnic groups as well as across income groups between June 2019 and December 2022. We present evidence that during this period, Black, Hispanic, and middle-income households were most affected by rising inflation, experiencing steadily higher price increases relative to the overall average between early 2021 and June 2022. This pattern is largely because a greater share of these groups’ expenditures is devoted to transportation, particularly used cars and motor fuel, categories that led the 2021 inflationary episode. However, over the last five months, as transportation inflation has declined, these gaps have declined as well.
Measuring Inflation Disparities
As there are no official estimates of inflation by demographic and income groups, we construct measures of demographic inflation by combining data from the Bureau of Labor Statistics’ Consumer Expenditure Surveys (CEX) on each group’s budget shares for over thirty categories of goods and services with CPI data on inflation rates for these categories.
In an innovation to the literature, we allow the CEX and CPI data to vary across twenty-three major U.S. metro areas, comprising nearly 40 percent of the U.S. population and ranging in size from St. Louis to New York City. CEX respondents not residing in one of these major metro areas are matched to the CPI of smaller cities and towns in their respective U.S. census region (Northeast, Midwest, South, or West).
This is an improvement on the procedure applied in our previous blog post, as well as on the literature covering the inflation differences observed in previous periods. This literature uses national prices that are fixed across geography and demographics at a specific point in time. In contrast, we allow prices to vary across metro areas, which has the advantage of assigning prices to households in a more accurate manner. An implicit assumption of our approach is that prices of goods are the same across demographic and income groups within a major metro area or for people outside of major metro area in the same census region, so that variation in inflation occurs only through differing consumption baskets and different location which is a much weaker assumption than the fixed price assumption used in the literature. We have explored using twice as many goods categories but not allowing inflation to vary by metro area (that is, using national prices), and have found broadly similar results.
Inflation Disparities by Race and Ethnicity
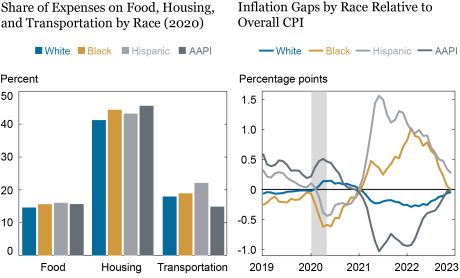
The chart below displays racial and ethnic disparities in inflation. The left panel shows average budget shares for three major consumption categories that have experienced high inflation since 2021—food, housing, and transportation—for white, Hispanic, Black, and Asian American/Pacific Islander (AAPI) households. Even though we use the entire consumption basket in our computations, and we disaggregate these categories considerably, we display only the three largest aggregate components, which comprise about two-thirds of the consumption basket, to illustrate our intuition. We see that Hispanic and Black households spend larger shares on transportation than do white and (especially) AAPI households. AAPI households devoted a higher share of their consumption spending on housing than the other racial/ethnic groups, and, alongside Hispanics, also spent a greater share on food. Drilling down into the composition of transportation spending (available on request), we see that Hispanic households spend a particularly large share of their budget on used cars and motor fuel, which bore the brunt of inflation in 2021-22. These differences in consumption baskets along with different inflationary patterns in these key consumption categories can explain the bulk of the inflation differences between demographic groups.
The right panel shows differences between the inflation rates experienced by each racial or ethnic group and the national average. If each group experienced the same inflation rate, all four lines would be at zero. In 2019, Hispanic and AAPI households experienced higher inflation than did white and Black households, likely because Hispanic and AAPI households resided disproportionately in the U.S. West, which had higher (though still modest) inflation at the time. This differential shrank shortly before the pandemic and subsequently became negative for Hispanic households during the pandemic recession, as transportation inflation fell. However, after the spring of 2021, when transportation inflation soared, the inflation rate experienced by Hispanic households exceeded the national average by over 1.5 percentage points (pp) in June 2021; for Black households, the gap stood at over 1 pp in February 2022. AAPI households experienced correspondingly lower inflation.
However, following June 2022, as transportation inflation began to moderate, inflation disparities across racial and ethnic groups began to shrink. As of December 2022, the inflation disparity for Hispanic households is at about 0.27 pp, a fraction of what it was at its height. The inflation experienced by Black and white households is below the national average, while AAPI households, who have been particularly affected by rising housing inflation, are now at the national average.
It is notable that our estimates of inflation disparities at the height of the 2021-22 inflationary episode increased as we updated our methodology to include more granular consumption categories (for example, decomposing transportation to look at separate price changes for used cars and new cars) and to allow prices to vary by metro area. With our new methodology, we find that the inflation rate experienced by Hispanic households was more than 1.5 pp above the national average in the spring of 2021; using the broader spending categories employed in our previous blog post, we found that they experienced an inflation gap of 0.7 pp during that time. As the consumption categories we are using are still quite coarse (we do not distinguish different brands of the same good from one another, for example), our results are consistent with inflation inequality being even higher than our current measurements indicate.
Inflation Disparities Narrow in 2022:Q3
Inflation Disparities by Income
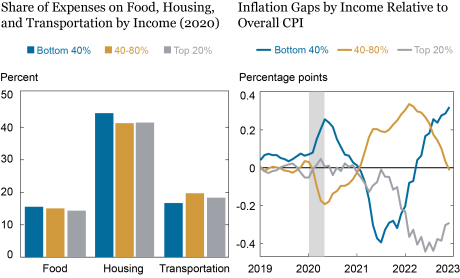
The next chart explores inflation disparities by household income. We consider three categories: households in the bottom two quintiles of the income distribution (roughly those earning below $50,000), households in the middle two quintiles (roughly between $50,000 and $150,000) and households in the top quintile (roughly earning over $150,000). The left panel presents the expenditure shares for the same three goods categories of these three income groups. Strikingly, the transportation share is not monotonic, with the middle-income group having a larger share than either of the other groups.
The right panel presents inflation disparities of the three income groups relative to the overall average. Before 2021, the disparities of the middle-income and high-income households tended to be small. Lower-income households experienced above-average inflation because of their higher proportional spending on food and housing, categories for which prices were rising more rapidly at the time (especially during 2020, with the onset of the pandemic). However, after inflation began to pick up in the spring of 2021, largely driven by transportation price inflation, the middle-income group consistently experienced a higher rate of inflation (by 0.2-0.3 pp) than the national average. The top 20 percent at first experienced higher inflation than the bottom 40 percent, since it had the next-highest transportation share, but as used car inflation subsided, it began experiencing the lowest inflation of the three groups. The bottom 40 percent at first experienced below-average inflation (by as much as 0.4 pp) because of its lower transportation share. However, as transportation inflation converged to the average, while food and housing inflation rose above the average, the bottom 40 percent have begun experiencing higher inflation than the national average. As of December 2022, the bottom 40 percent have the highest year-on-year inflation rate of the three groups, and the inflation rate of the middle-income group is below the national average. It is likely the case that the same rate of inflation represents a greater welfare loss for lower-income than higher-income households because of the former’s lower capacity for substituting to less expensive goods, greater liquidity constraints, and larger marginal utility of real income.
Middle-Income Households Experienced Highest Inflation in 2021, Lower-Income Households Face Highest Inflation Now
Conclusion
Inflation disparities, having widened as inflation rose sharply in 2021 because of differing exposures to transportation costs across demographic and income groups, are now narrowing as transportation inflation converges toward average inflation. As prices in other categories have begun to rise more rapidly, the pattern of inflation inequality is changing, with groups that have larger expenditure shares on these components, such as AAPI and lower income households, experiencing higher inflation. In the next post of this series, we will consider the implications of different inflationary patterns for different goods in terms of inflation inequality across other economic and demographic categories—education and age.

Rajashri Chakrabarti is the head of Equitable Growth Studies in the Federal Reserve Bank of New York’s Research and Statistics Group.

Dan Garcia is a research analyst in the Federal Reserve Bank of New York’s Research and Statistics Group.

Maxim Pinkovskiy is an economic research advisor in Equitable Growth Studies in the Federal Reserve Bank of New York’s Research and Statistics Group.
How to cite this post:
Rajashri Chakrabarti, Dan Garcia, and Maxim Pinkovskiy, “Inflation Disparities by Race and Income Narrow,” Federal Reserve Bank of New York Liberty Street Economics, January 18, 2023, https://libertystreeteconomics.newyorkfed.org/2023/01/inflation-disparities-by-race-and-income-narrow/
BibTeX: View |
Disclaimer
The views expressed in this post are those of the author(s) and do not necessarily reflect the position of the Federal Reserve Bank of New York or the Federal Reserve System. Any errors or omissions are the responsibility of the author(s).
 RSS Feed
 Follow Liberty Street Economics
Very nice data presernted on inflation by authors and nice focus on it. Really it is concern issue for globaly and directly affected on consumers.