


We continue our series on inflation disparities by looking at disparities in inflation rates by educational attainment and age for the period June 2019 to the present. Remarkably, we find that disparities by age and education are considerably larger than those by income and are similar in size to those by race and ethnicity, both explored in our previous post. Specifically, during the inflationary period of 2021-22, younger people and people without a college degree faced the highest inflation, with steadily widening gaps relative to the overall average between early 2021 and June 2022, followed by a rapid narrowing of the gaps and a reversal of some of them by December 2022. This pattern arises primarily from a greater share of the expenditures of younger people and people without a college degree being devoted to transportation—particularly used cars and motor fuel—which led the 2021 inflationary episode but has since converged to general inflation.
This second post follows the same approach as the first post. Because there are no official estimates of inflation by age and educational attainment, we construct measures of demographic inflation by combining data on each group’s budget shares of more than thirty goods categories (from the Bureau of Labor Statistics’ Consumer Expenditure Surveys, or CEX) with CPI data on these categories’ inflation rates, allowing CPIs to vary across twenty-three major metro areas and four census regions. An implicit assumption of this approach is that people of different ages and educational attainments living in the same major city face the same prices for, say, used cars or beef, so that variation in inflation occurs only through differing consumption baskets. However, if people of differing educational attainment shop in different stores and purchase different brands within the same expenditure category, our assumption could be violated.
Inflation Disparities by Educational Attainment
Disparities in inflation by educational attainment are displayed in the chart below. The left panel shows average budget shares for three major consumption categories that have experienced high inflation since 2021—food, housing, and transportation—for households in which at least one household member interviewed by the CEX has a bachelor’s degree (college households), compared to households in which none of the interviewed household members have a bachelor’s degree (no-college households). Even though we use the entire consumption basket in our computations and we disaggregate these categories considerably, we display only the three largest aggregate components—which comprise about two-thirds of the consumption basket—to illustrate our underlying intuition. We see that no-college households spend larger shares on transportation than do college households. Drilling down into the composition of transportation (not shown in the chart but available on request), no-college households spend a particularly large share of their budget on used cars and motor fuel, which bore the brunt of inflation in 2021-22.
Inflation Disparities by Education Disappear in 2022:Q4 after 2021 Highs
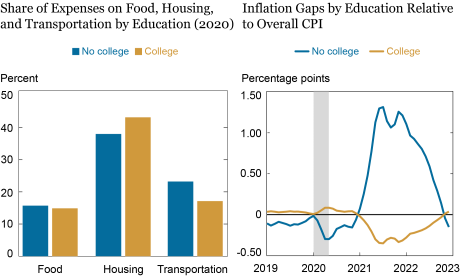
The right panel of the chart shows differences between inflation as experienced by each educational group and the national average. While inflation disparities across educational groups were modest before and during the pandemic—no-college households experienced inflation that was 0.3 percentage point (pp) lower than that of the national average—they expanded after the spring of 2021, with no-college households experiencing as much as 1.3 pp higher inflation than the national average and college households experiencing 0.35 pp lower inflation than the national average in June 2021. However, following June 2022, as transportation inflation began to moderate, inflation disparities across educational groups began to shrink rapidly. As of December 2022, the disparity has reversed, with no-college households experiencing lower inflation over the last twelve months than college households did. The reversal of the earlier rise in inflation disparities can be explained by 1) transportation inflation, which affects no-college households relatively more, declining back to the headline CPI, and 2) housing inflation, which affects college households relatively more, rising faster than headline CPI.
Inflation Disparities by Age
Disparities based on the age of the oldest household member interviewed by the CEX are explored in the next chart. We consider three categories: households in which the oldest respondent is younger than 25, is age 25-54 (prime working age, as defined by the BLS), and is age 55 or older. The left panel presents the expenditure shares for the same three goods categories for these three age groups. The transportation share is monotonically decreasing, with older households allocating a considerably smaller share of their spending to transportation than either younger or prime-age households. However, the food share is considerably lower for younger households than for prime-age or older households.
Younger Americans Experienced Higher Inflation, but the Gap Has Closed
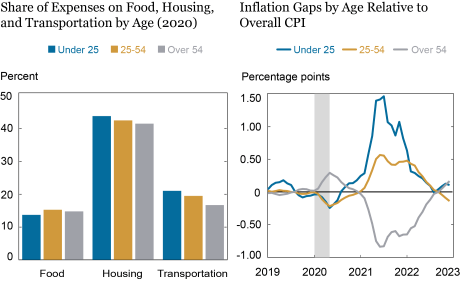
Inflation disparities of the three age groups relative to the overall average are shown in the right panel of the chart. Before 2021, the disparities of the middle-age and older households tended to be moderate, with the young experiencing somewhat higher inflation than the average in 2019 and lower inflation (by 0.25 pp) during the pandemic. However, after inflation picked up in the spring of 2021, largely driven by transportation price inflation, the young experienced as much as 1.5 pp higher inflation than the national average (July 2021). Prime-age households experienced inflation that was as much as 0.57 pp higher than the national average, while older households experienced inflation that was 0.84 pp lower than the national average at that time. By early 2022, as used car inflation was beginning to wane, inflation disparities by age began declining as well, shrinking to 0.17 pp at most by December 2022. Moreover, older households currently experience slightly higher inflation than younger households do, with prime-age households’ inflation rate being below the national average.
Conclusion
To conclude, inflation disparities across education and age groups—having widened as inflation rose sharply in 2021 because of the groups’ differential reliance on transportation—are now narrowing as transportation inflation converges toward average inflation. As prices in other categories, such as housing and food, began to rise more rapidly, the pattern of inflation inequality changed. Groups with larger expenditure shares on these components, such as college-educated and older households, are experiencing higher inflation. In our next post, we will see the implications of this pattern for inflation differentials across geography.

Rajashri Chakrabarti is the head of Equitable Growth Studies in the Federal Reserve Bank of New York’s Research and Statistics Group.

Dan Garcia is a research analyst in the Federal Reserve Bank of New York’s Research and Statistics Group.

Maxim Pinkovskiy is an economic research advisor in Equitable Growth Studies in the Federal Reserve Bank of New York’s Research and Statistics Group.
How to cite this post:
Rajashri Chakrabarti, Dan Garcia, and Maxim Pinkovskiy, “Young, Less Educated Faced Higher Inflation in 2021—But Gaps Now Closed,” Federal Reserve Bank of New York Liberty Street Economics, January 18, 2023, https://libertystreeteconomics.newyorkfed.org/2023/01/young-less-educated-faced-higher-inflation-in-2021-but-gaps-now-closed/
BibTeX: View |
Was the 2021-22 Rise in Inflation Equitable? (June 2022)
Disclaimer
The views expressed in this post are those of the author(s) and do not necessarily reflect the position of the Federal Reserve Bank of New York or the Federal Reserve System. Any errors or omissions are the responsibility of the author(s).
 RSS Feed
 Follow Liberty Street Economics