


Editor’s note: Since this post was first published, in a few instances we have updated inexact descriptions to clarify the demographic discussion. These updates did not affect our findings. (July 13, 3:52pm)
In our previous post, we discussed how the labor market recovery—the “maximum employment” half of the Federal Reserve System’s dual mandate—featured not only a return of overall employment rates to pre-pandemic levels, but also a narrowing of racial and ethnic gaps in employment rates. In this post, we take up the second half of the dual mandate—price stability—and discuss heterogeneity in inflation rates faced by different demographic groups during the rise in inflation in
2021-22. We find that, in contrast to inequalities in employment rates, disparities in inflation rates have widened during the recent inflationary episode, with Black and Hispanic Americans experiencing more inflation.
While employment rates for racial and ethnic groups are tracked by the Bureau of Labor Statistics (BLS), there are no demographic-specific official measures of inflation rates. However, the BLS computes separate inflation indexes (consumer price indexes, or CPIs) for different categories of goods, such as food, clothing, energy, housing, or entertainment. The BLS also conducts a Consumer Expenditure Survey (CEX), which allows one to see how different demographic groups allocate their spending to these different categories. For example, as the 2019 CEX shows, Black Americans spend relatively more on transportation and housing and relatively less on food and entertainment than white Americans do.
Using a procedure similar to several papers in the literature, we assume that prices within each goods category are the same for everyone and are well represented by the CPIs, but that different groups consume different amounts of goods from different categories. We can then obtain estimates of the inflation of the consumption basket for each demographic group as a weighted average of the CPIs of the components of the consumption basket, with the weights being that group’s shares of the components. We call this inflation measure Demo-CPI, which will be the basis for our statements about changing inflation gaps across demographics over time. It is likely that our procedure underestimates inflation disparities between different groups of Americans because, in addition to consuming different bundles of goods, different demographics likely face different prices for the same goods, with lower-income Americans and Black Americans facing higher price growth.
The chart below shows the time path of twelve-month inflation for the national average for the major consumption categories that we consider. Before the pandemic, average CPI inflation was steady at around 2 percent. Once the COVID-19 recession began in March 2020, inflation fell (as it often does in recessions), collapsing to nearly zero at one point, and slowly recovered back to its pre-pandemic level over the remainder of 2020 after lockdowns were lifted and the COVID-19 recession ended. However, in early 2021, inflation soared far above 2 percent, and it has been increasing up to the present. Currently, inflation in the major consumption categories we consider (Demo-CPI) is 9.2 percent year-on-year, which is more than the CPI for all urban consumers (CPI-U, 8.6 percent) but close to the CPI for urban wage earners and clerical workers (CPI-W, 9.3 percent). The differences can likely be explained by the fact that the CEX is not restricted to urban residents while the CPI-U is, and by differences in the coverages of some goods categories between the CEX and the CPI-U.
Inflation Soars in 2021-22
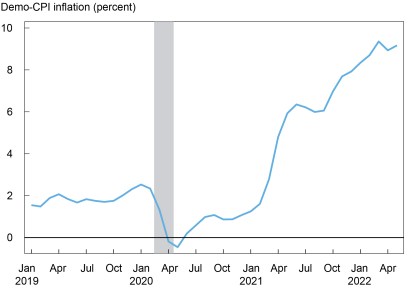
Note: The shaded area indicates a period designated a recession by the National Bureau of Economic Research.
We now turn to discussing disparities in this overall Demo-CPI inflation rate across demographic groups. The chart below plots deviations from the trend in the prior chart for white, Black, Hispanic, and Asian Americans between 2019 and the present. As in our previous post, if inflation gaps remain constant over time, we would expect to see straight horizontal lines for the different demographic groups. This is roughly the case during 2019, when Asian Americans experienced slightly more inflation than did the national average , while Black and Hispanic Americans experienced slightly less (white Americans on average experience inflation similar to the national average). With the COVID-19 recession, the picture changed noticeably. Inflation for Black and Hispanic Americans fell, while inflation for Asian Americans rose relative to the national average, as prices for housing and apparel grew more slowly than the national average, while prices for food grew faster. After the end of the COVID-19 recession in May 2020, inflation differentials for different racial and ethnic groups declined again. However, when overall inflation began rising in March 2021, inflation disparities surged, with Black and Hispanic Americans experiencing higher inflation than the national average and Asian Americans experiencing lower inflation. These disparities are more than twice as large as those observed during 2019.
While the measured magnitudes of the inflation disparities are not very large (0.2-0.6 percentage point for Black and Hispanic Americans relative to the 9.2 percent overall inflation rate), they likely underestimate the actual gaps for the reasons mentioned above, with the actual gaps likely being considerably higher. The changes in the gaps relative to 2019 should be more informative, however, and suggest large changes in the magnitude of inflation inequality.
Demographic Inflation Gaps Small Before Pandemic, Open Up During Inflation Rise
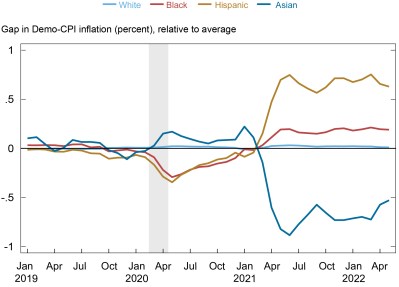
Notes: Demographic categories are not mutually exclusive. The shaded area indicates a period designated a recession by the National Bureau of Economic Research.
There is a strong contrast between the widening demographic disparities in inflation and the narrowing demographic gaps in employment rates that we observed in our previous post. In many ways, the situation is the reverse of what happened during the long recovery from the Great Recession. Then, inflation remained quiescent, while employment rates remained below their pre-crisis levels for years, with Black and Hispanic Americans experiencing particularly prolonged employment slumps. Currently, employment rates, both on average and for Black and Hispanic Americans, are nearly back to their pre-COVID levels, with employment gaps for Black and Hispanic Americans close to multi-decade lows. However, inflation has risen sharply overall and especially for Black and Hispanic Americans. These facts are important to consider in pursuing a monetary policy that strives for maximum employment and price stability for all Americans. The ways in which different demographic groups experience inflation and the Fed’s response to it will be an important issue that we will continue to track.

Ruchi Avtar is a research analyst in Equitable Growth Studies in the Federal Reserve Bank of New York’s Research and Statistics Group.

Rajashri Chakrabarti is the head of Equitable Growth Studies in the Federal Reserve Bank of New York’s Research and Statistics Group.

Maxim Pinkovskiy is an economic research advisor in Equitable Growth Studies in the Federal Reserve Bank of New York’s Research and Statistics Group.
How to cite this post:
Ruchi Avtar, Rajashri Chakrabarti, and Maxim Pinkovskiy, “Was the 2021‑22 Rise in Inflation Equitable?,” Federal Reserve Bank of New York Liberty Street Economics, June 30, 2022, https://libertystreeteconomics.newyorkfed.org/2022/06/was-the-2021-22-rise-in-inflation-equitable/
BibTeX: View |
Disclaimer
The views expressed in this post are those of the author(s) and do not necessarily reflect the position of the Federal Reserve Bank of New York or the Federal Reserve System. Any errors or omissions are the responsibility of the author(s).
 RSS Feed
 Follow Liberty Street Economics
Great study. Thanks. Would really love to see the second graph also broken out by income quintiles.