


To conclude our series, we present disparities in inflation rates by U.S. census region and rural status between June 2019 and the present. Notably, rural households were hit by inflation the hardest during the 2021-22 inflationary episode. This is intuitive, as rural households rely on transportation, and especially on motor fuel, to a much greater extent than urban households do. More generally, the recent rise in inflation has affected households in the South more than the national average, and households in the Northeast by less than the national average, though this difference has decreased in the last few months. Once again, these changes in inflation patterns can be explained by transportation inflation driving a large extent of price rises during 2021 and much of 2022, with housing and food inflation lately coming to the fore.
Unlike for the other heterogeneities explored in this series on inflation disparities, the BLS provides estimates of the CPI by U.S. census region (Northeast, South, Midwest and West). Therefore, we use them to compute inflation differences between the census regions and the national average. We use the methodology from our previous posts—combining budget shares from the Bureau of Labor Statistics’ Consumer Expenditure Surveys (CEX) with CPI inflation measures at the metro area and census region level —to compute the rural-urban inflation differential. However, an additional complication of the latter analysis is that while the CEX surveys both urban and rural households, the CPI collects only urban prices for each census region. Therefore, following Hobijn and Lagakos (2005), when measuring the inflationary experience of rural households, we are using rural budget shares but not rural prices. We therefore caveat our results on rural households but consider them worth reporting given the large and intuitive inflation disparity that we uncover.
Inflation Disparities across Census Regions
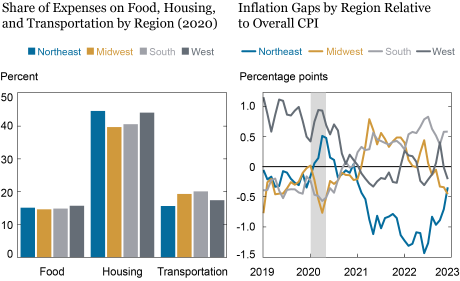
The chart below displays disparities in inflation by U.S. census regions. The left panel shows budget shares for three major consumption categories that have experienced high inflation since 2021—food, housing, and transportation—for households located in these regions. Even though we use the entire consumption basket in our computations, and we disaggregate these categories considerably, we display only the three largest aggregate components, which comprise about two-thirds of the consumption basket, to illustrate our case. We see that households in the Midwest and (especially) the South have a larger transportation share of their consumption basket, but that households in the West and (especially) the Northeast have larger budget shares of housing.
The right panel shows differences between CPI inflation as experienced by each region and the national average. If each region experienced the same inflation rate, all four lines would be at zero. Before the pandemic, inflation in the West census region ran at 1.15 percentage point (pp) higher than the national average likely because of the high housing budget share and rising housing prices in the West—while the inflation rates in the other three regions were below the national average by as much as 0.8 pp. During the pandemic recession, inflation differences in the West and Northeast spiked, while inflation differences in the South and Midwest became more negative, but as the economy recovered from the pandemic recession, inflation in all regions including the West returned to the national average.
However, inflation differentials expanded again during the 2021 inflationary episode. At first, when transportation inflation was driving the overall inflation increase, inflation in the Midwest and in the South ran above the national average by about 0.5 pp in July, while households in the Northeast experienced 1 pp lower inflation than the national average, and inflation in the West was modestly below the national average. As of December 2022, as transportation inflation pressures are subsiding and housing inflation is picking up, inflation in the South is 0.6 pp above the national average, followed by inflation in the West, which is 0.2 percent below the national average. Inflation in the Northeast is still about one-third of a percentage point less than the national average but rising rapidly, and exceeded inflation in the Midwest this month, which is now 0.45 pp below the national average. While the Midwest and the South bore a greater brunt of transportation inflation in 2021, the Northeast enjoyed relatively milder inflation than the nation as a whole.
The South and the Midwest Bore the Brunt of Transportation Inflation in 2021 while Northeast Inflation Is Rising Rapidly Now
Inflation Disparities of Rural Households
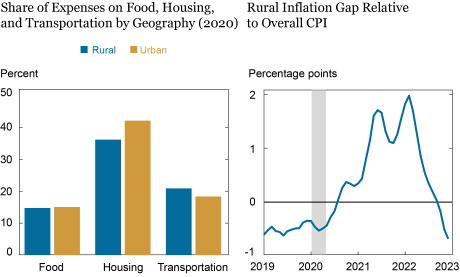
The next chart explores inflation disparities by the rural status of the household. Rural households are defined as those residing in rural nonmetropolitan areas that are not covered by the CPI. The left panel presents the expenditure shares for the same three goods categories of rural and urban households. Not surprisingly, rural households spend a larger share of their budget on transportation, while urban households spend a larger share of their budget on housing.
The right panel presents inflation disparities of rural households relative to the urban average inflation. This chart is different from all the previous inflation disparity charts in this series because it combines CEX consumption shares of rural households with CPI data on urban prices as in the existing literature (data on rural prices is not collected). As rural prices could be systematically different, the conclusions we reach based on this chart are tentative. We also omit the line for the inflation disparity for urban consumers, as it is by construction very close to the horizontal line at zero.
Before 2021 and during the pandemic recession, rural households experienced persistently lower inflation (once again, at urban prices) by about 0.5 pp than urban households did. This can be explained to a large extent by low transportation inflation and the much higher transportation budget share of rural households. However, as transportation inflation soared in 2021, rural inflation climbed to over 2 pp higher than the urban average by February 2022. Rural inflation remained more than 1 pp higher than the urban average until May 2022, when falling transportation inflation and rising housing inflation decreased inflation inequality. In December 2022, rural inflation is once again below the national average by about 0.7 pp.
The Rise and Fall of Rural Inflation
Conclusion
To conclude, under the assumption that urban price growth is similar to rural price growth within relatively narrow categories of goods, rural households experienced considerably higher inflation than urban households did, especially relative to what was the case before the 2021 inflationary episode. Among U.S. census regions, the South experienced higher inflation than the national average, while the Northeast experienced lower inflation, though these patterns are beginning to reverse. All of these patterns can generally be explained by the variations in housing and transportation shares across regions and between urban and rural households and the variation of these prices. We will continue to monitor inflation inequality as the Federal Reserve System continues to work to reduce overall inflation to the FOMC’s longer-run goal.

Rajashri Chakrabarti is the head of Equitable Growth Studies in the Federal Reserve Bank of New York’s Research and Statistics Group.

Dan Garcia is a research analyst in the Federal Reserve Bank of New York’s Research and Statistics Group.

Maxim Pinkovskiy is an economic research advisor in Equitable Growth Studies in the Federal Reserve Bank of New York’s Research and Statistics Group.
How to cite this post:
Rajashri Chakrabarti, Dan Garcia, and Maxim Pinkovskiy, “Rural Households Hit Hardest by Inflation in 2021‑22,” Federal Reserve Bank of New York Liberty Street Economics, January 18, 2023, https://libertystreeteconomics.newyorkfed.org/2023/01/rural-households-hit-hardest-by-inflation-in-2021-22/
BibTeX: View |
Disclaimer
The views expressed in this post are those of the author(s) and do not necessarily reflect the position of the Federal Reserve Bank of New York or the Federal Reserve System. Any errors or omissions are the responsibility of the author(s).
 RSS Feed
 Follow Liberty Street Economics