


In a January 2022 post, we first presented the Global Supply Chain Pressure Index (GSCPI), a parsimonious global measure designed to capture supply chain disruptions using a range of indicators. The spirit of our index was to isolate supply factors, such as shutdowns in response to the pandemic, that put pressure on the global supply chain. In this post, we describe an auxiliary index, the Net GSCPI, which differs from the GSCPI by not filtering out demand factors. This “net” index is meant to capture global supply chain stress from both the supply and demand sides. Our analysis documents that the net index is currently below its historical average, unlike the original index, due to both the easing of supply constraints and a contraction in global demand.
The Net Global Supply Chain Pressure Index
To construct the Net Global Supply Chain Pressure Index, we use the same series as our original GSCPI but do not filter out the demand effect from the underlying series. The net index can be interpreted as capturing the net impact of supply and demand factors on the global supply chain. In the following chart, we plot both indexes from 1997 to December 2022.
The Net GSCPI and the GSCPI over Time
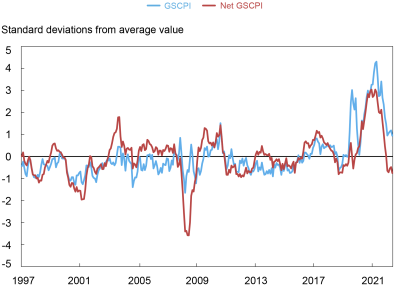
Note: Index is scaled by its historical standard deviation.
In general, the two series move independently, indicating that pressures on supply chains are not necessarily driven by the supply factors captured by the GSCPI. There are two particularly interesting episodes to consider. The first is the initial reopening from pandemic lockdown, when both indicators reached their highest levels, signaling that supply factors were the dominant influence. The other is during the global financial crisis, when the Net GSCPI dropped sharply given the collapse in demand while the original GSCPI stayed near its historical average. The most recent readings of the Net GSCPI indicator are now in negative territory, unlike the GSCPI, indicating an easing in pressures on the supply chain from softening demand.
Easing of Net Imbalances: Demand- or Supply-Driven?
Before proceeding in our analysis, we first recall that our indices are expressed in standard deviations from their historical averages. For this reason, a direct comparison between the two is misleading since their historical averages are different. We then proceed by normalizing the two indexes at zero at a given point in time and exploit this normalization to extract a proxy for a global demand component as a difference between the two indicators from that point in time.
When the net index is above the GSCPI, the global demand component is contributing positively to net supply chain pressures. When the net index is below the GSCPI, the global demand component is contributing negatively (in other words, reduced demand is easing net supply pressure). In the following chart, we examine the evolution of the two indices starting from the onset of the pandemic (beginning of 2020). We normalize the indices to zero at the beginning of 2020. The gray bars represent the contribution of the global demand component at each point in time, constructed as the difference between the two indexes as described above.
The Extracted Demand Factor since the Beginning of the Pandemic
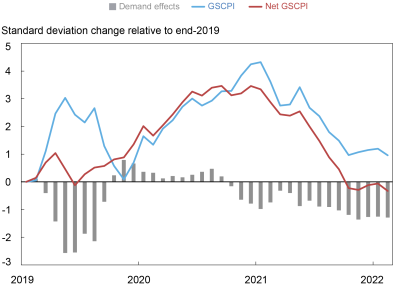
Note: Index is scaled by its historical standard deviation and normalized to zero at the beginning of 2020.
During the first phase of the pandemic, supply disruptions were present as the global economy was in lockdown mode, but global demand contraction was so extreme that net pressures at the global supply chain level were modest and comparable with historical observations.
As the global economy reopened, supply chain pressures started to emerge and were mainly driven by supply factors implicitly captured by our GSCPI. Indeed, during 2021 the net index and our original GSCPI mostly overlap until late in the year. Over the course of late 2020 through the first three quarters of 2021, global demand factors contributed positively to global supply pressures, but the contributions were relatively modest relative to the overall magnitude of supply factors.
Currently, a mix of supply and demand forces is driving the easing of net pressure at the level of the global supply chain. It is interesting to note that there is a persistent and increasing contraction in the global demand factor during most of 2022. The data releases for the GSCPI during the final quarter of last year signaled a modest worsening of supply factors—driven by pandemic-related developments in China—as the GSCPI ticked up while the global demand component continued to contract.
Conclusion
The Net GSCPI is an alternative indicator of pressure on the global supply chain. (Note that we do not anticipate updating the Net GSCPI on a regular basis.) We have used it to extract a global demand factor and interpret the evolution of net pressure considering demand and supply forces. Previously, we used it to examine how much of the resurgent upward supply chain pressures can be attributed to China’s evolving policies in response to the COVID-19 outbreak. Next in our analysis is to use these tools to provide a framework for understanding the dynamics of different measures of inflation.

Gianluca Benigno is a professor of economics at the University of Lausanne and former head of International Studies in the Federal Reserve Bank of New York’s Research and Statistics Group.

Hunter L. Clark is an international policy advisor in International Studies in the Federal Reserve Bank of New York’s Research and Statistics Group.

William Cross-Bermingham is a research analyst in the Federal Reserve Bank of New York’s Research and Statistics Group.

Ethan Nourbash is a research analyst in the Federal Reserve Bank of New York’s Research and Statistics Group.
How to cite this post:
Gianluca Benigno, Hunter L. Clark, William Cross-Bermingham, and Ethan Nourbash, “How Have Swings in Demand Affected Global Supply Chain Pressures?,” Federal Reserve Bank of New York Liberty Street Economics, February 21, 2023, https://libertystreeteconomics.newyorkfed.org/2023/02/how-have-swings-in-demand-affected-global-supply-chain-pressures/
BibTeX: View |


Disclaimer
The views expressed in this post are those of the author(s) and do not necessarily reflect the position of the Federal Reserve Bank of New York or the Federal Reserve System. Any errors or omissions are the responsibility of the author(s).
 RSS Feed
 Follow Liberty Street Economics