


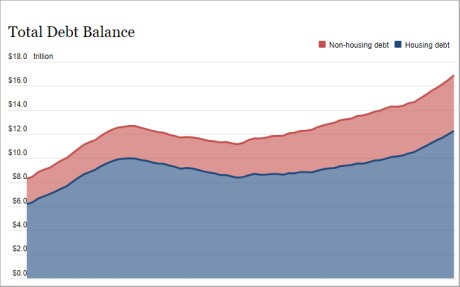
Total debt balances grew by $148 billion in the first quarter of 2023, a modest increase after 2022’s record growth. Mortgages, the largest form of household debt, grew by only $121 billion, according to the latest Quarterly Report on Household Debt and Credit from the New York Fed’s Center for Microeconomic Data. The increase was tempered by a sharp reduction in both purchase and refinance mortgage originations. The pandemic boom in purchase originations was driven by many factors – low mortgage rates, strong household balance sheets, and an increased demand for housing. Homeowners who refinanced in 2020 and 2021 benefitted from historically low interest rates and will be enjoying low financing costs for decades to come. These “rate refinance” borrowers have lowered their monthly mortgage payments, improving their cash flow, while other “cash-out” borrowers extracted equity from their real estate assets, making more cash available for consumption. Here, we explore the refi boom of 2020-21–who refinanced, who took out cash, and how much potential consumption support these transactions provided. In this analysis, as well as the Quarterly Report, we use our Consumer Credit Panel (CCP), which is based on anonymized credit reports from Equifax.
The Refinance Boom
In the chart below, we disaggregate the volume of mortgage originations into purchase and refinance mortgages. The COVID refinance boom, which we observe from the second quarter of 2020 through the fourth quarter of 2021, was spurred by a decline in mortgage interest rates of nearly 200 basis points from November 2018 to November 2020. The 2003 refinance boom was similarly spurred by an approximate 200 basis point decline, as was the mini-boom in 2013. But there are at least three characteristics that distinguished the recent boom in refinancing from earlier ones. First, in the 2020-21 pandemic years, interest rates were historically low; many homeowners took advantage of these low rates by extracting equity, reducing monthly payments, or shortening terms. Second, the rebound in mortgage interest rates, after reaching this low, was historically steep. This put a quick end to the surge in refinances. Finally, home equity was at an all-time high leading into the pandemic, and when home prices continued to rise, many borrowers had home equity to tap.
Approximately one-third of outstanding mortgage balances was refinanced during the seven quarters of the refi boom, and an additional 17 percent of mortgages outstanding were refreshed through home sales during a time of high demand for housing. Then, rates rose by 400 basis points from a historically low 2.68 percent contract rate on 30-year mortgages in December 2020 to 6.90 percent in October 2022, a swing of an amplitude not seen since the early 1980s, according to Freddie Mac’s Primary Mortgage Market Survey. By the first quarter of 2023, incentives to refinance were harder to find, and the refinance rate dropped near a historic low, shown by the red line in the chart below.
Mortgage Originations Taper Down
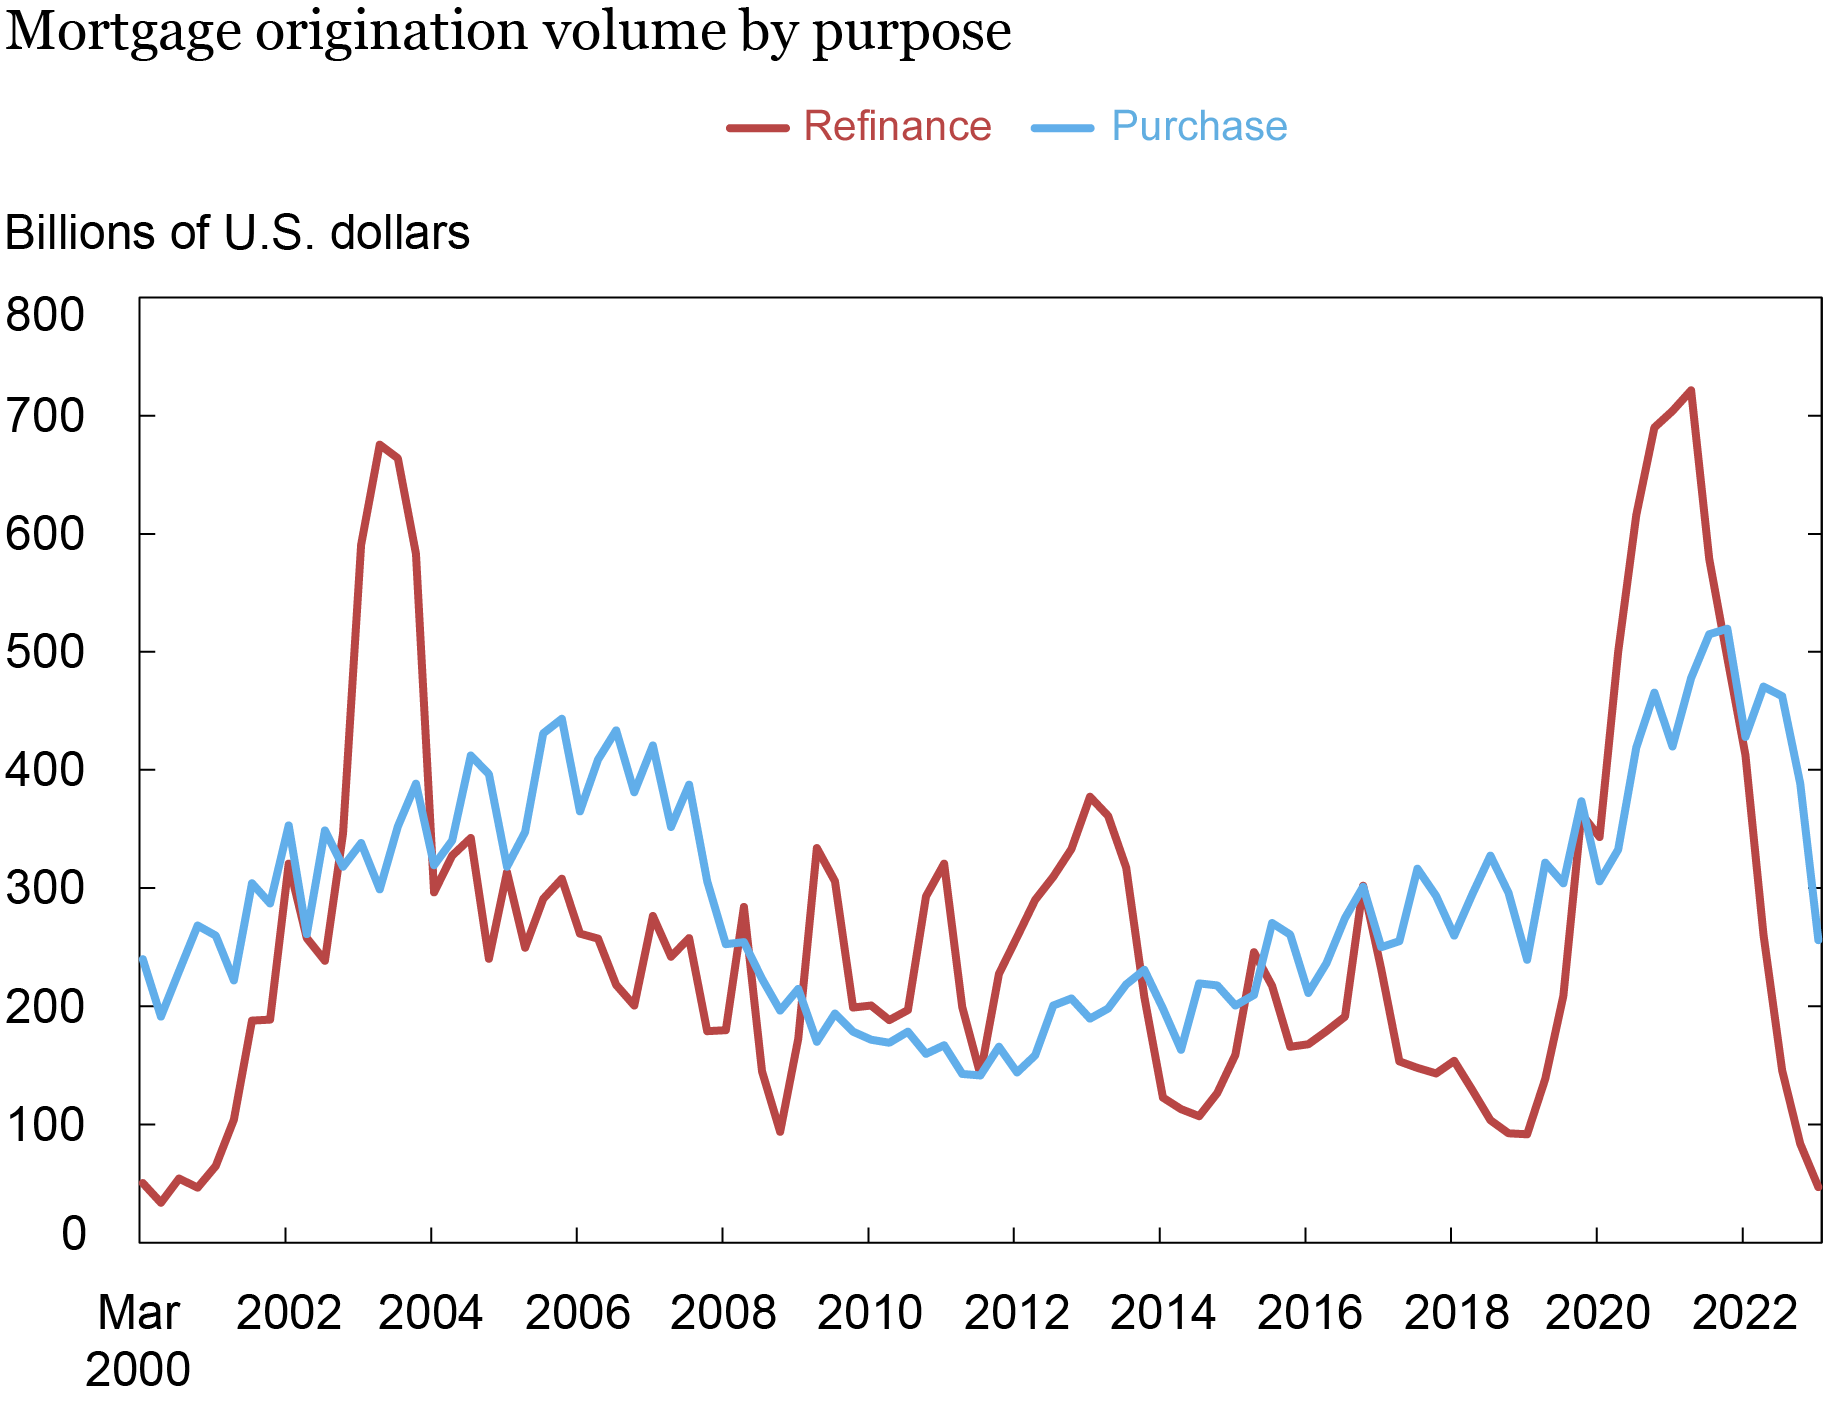
Notes: Due to lags in credit reporting, originations may lag in recording by 6-8 weeks. Balances are in nominal dollars.
Cash Out or Cash Flow?
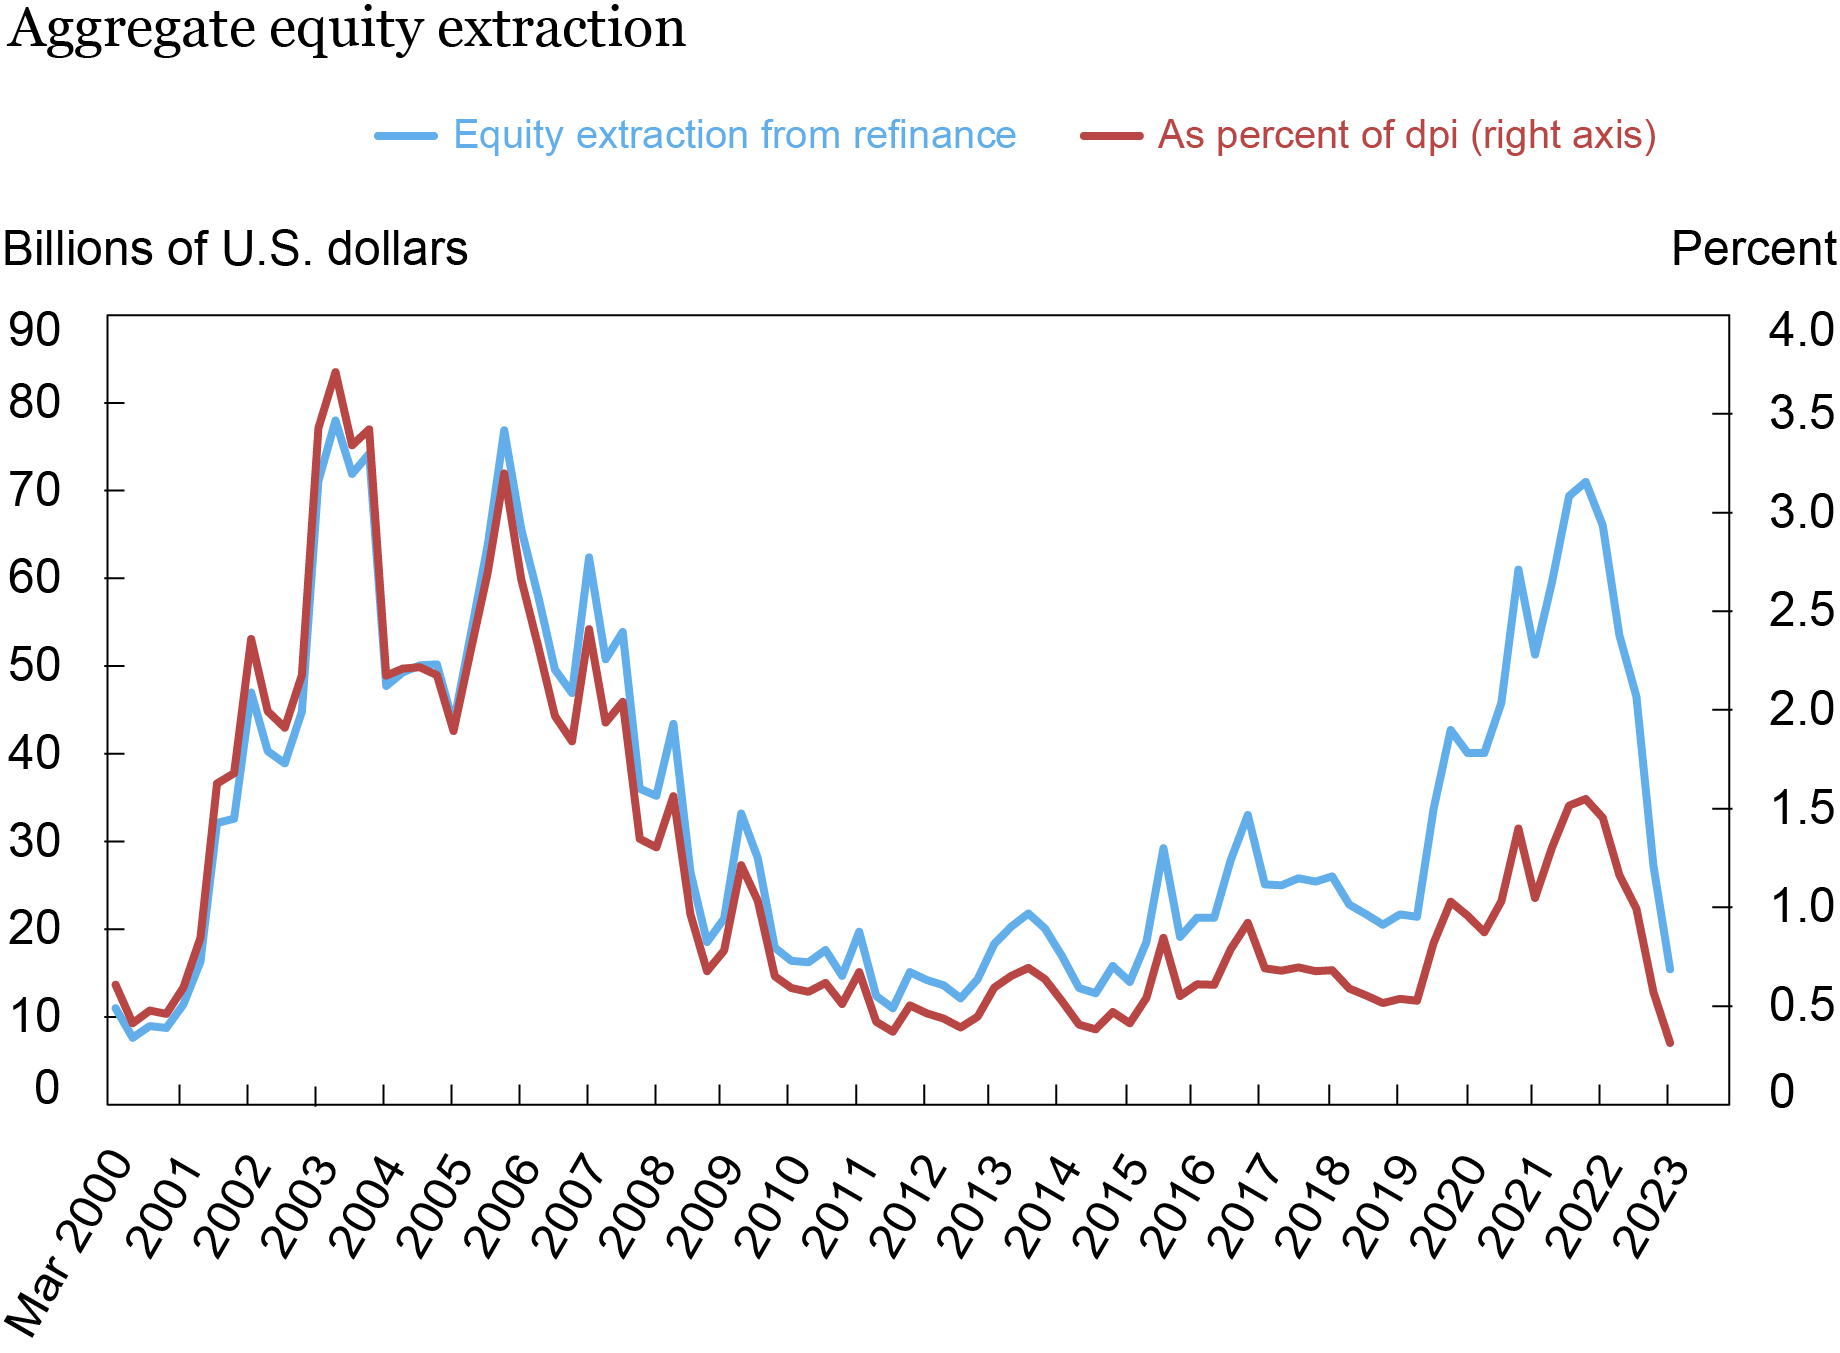
In the chart below, we depict the cash value of nominal equity extraction over time. Between the second quarter of 2020 and the fourth quarter of 2021, we estimate that $430 billion in home equity was extracted using mortgage refinances as shown in the chart below. The pace of equity extraction screeched to a halt when mortgage rates began climbing and quarterly equity extraction volumes were near historic lows in the first quarter of 2023, particularly as a share of disposable personal income, as shown by the red line below. That line also shows that while the recent pickup in cash out is noticeable, as a share of income it is not nearly as consequential as the 2002-05 refi boom.
Home Equity Extraction during Pandemic Refi Boom
About 14 million mortgages were refinanced during the seven quarters, with 64 percent of the refinances as “rate refinances,” which we classify here as those with a balance increase of less than 5 percent of the borrowing amount. For the rate refinancers, the average monthly payment dropped by $220. For cash-out refinancers, the average amount cashed out was $82,000 and the average monthly payment increased by $150.
Who Refinanced?
We next take a look at some key characteristics of the mortgages that were refinanced during the pandemic.
We first consider the loan age and balance of the outstanding pool of mortgages. Older vintage mortgages—those originated before 2010—were the least likely to refinance. In fact, under 9 percent of the mortgages that had been originated before 2010 that were still in repayment in 2020 were refinanced. About 17 percent of mortgages that had been originated between 2010 and 2014 were refinanced. By contrast, nearly a third of mortgages from 2015 and later vintages were refinanced during the quarters in question.
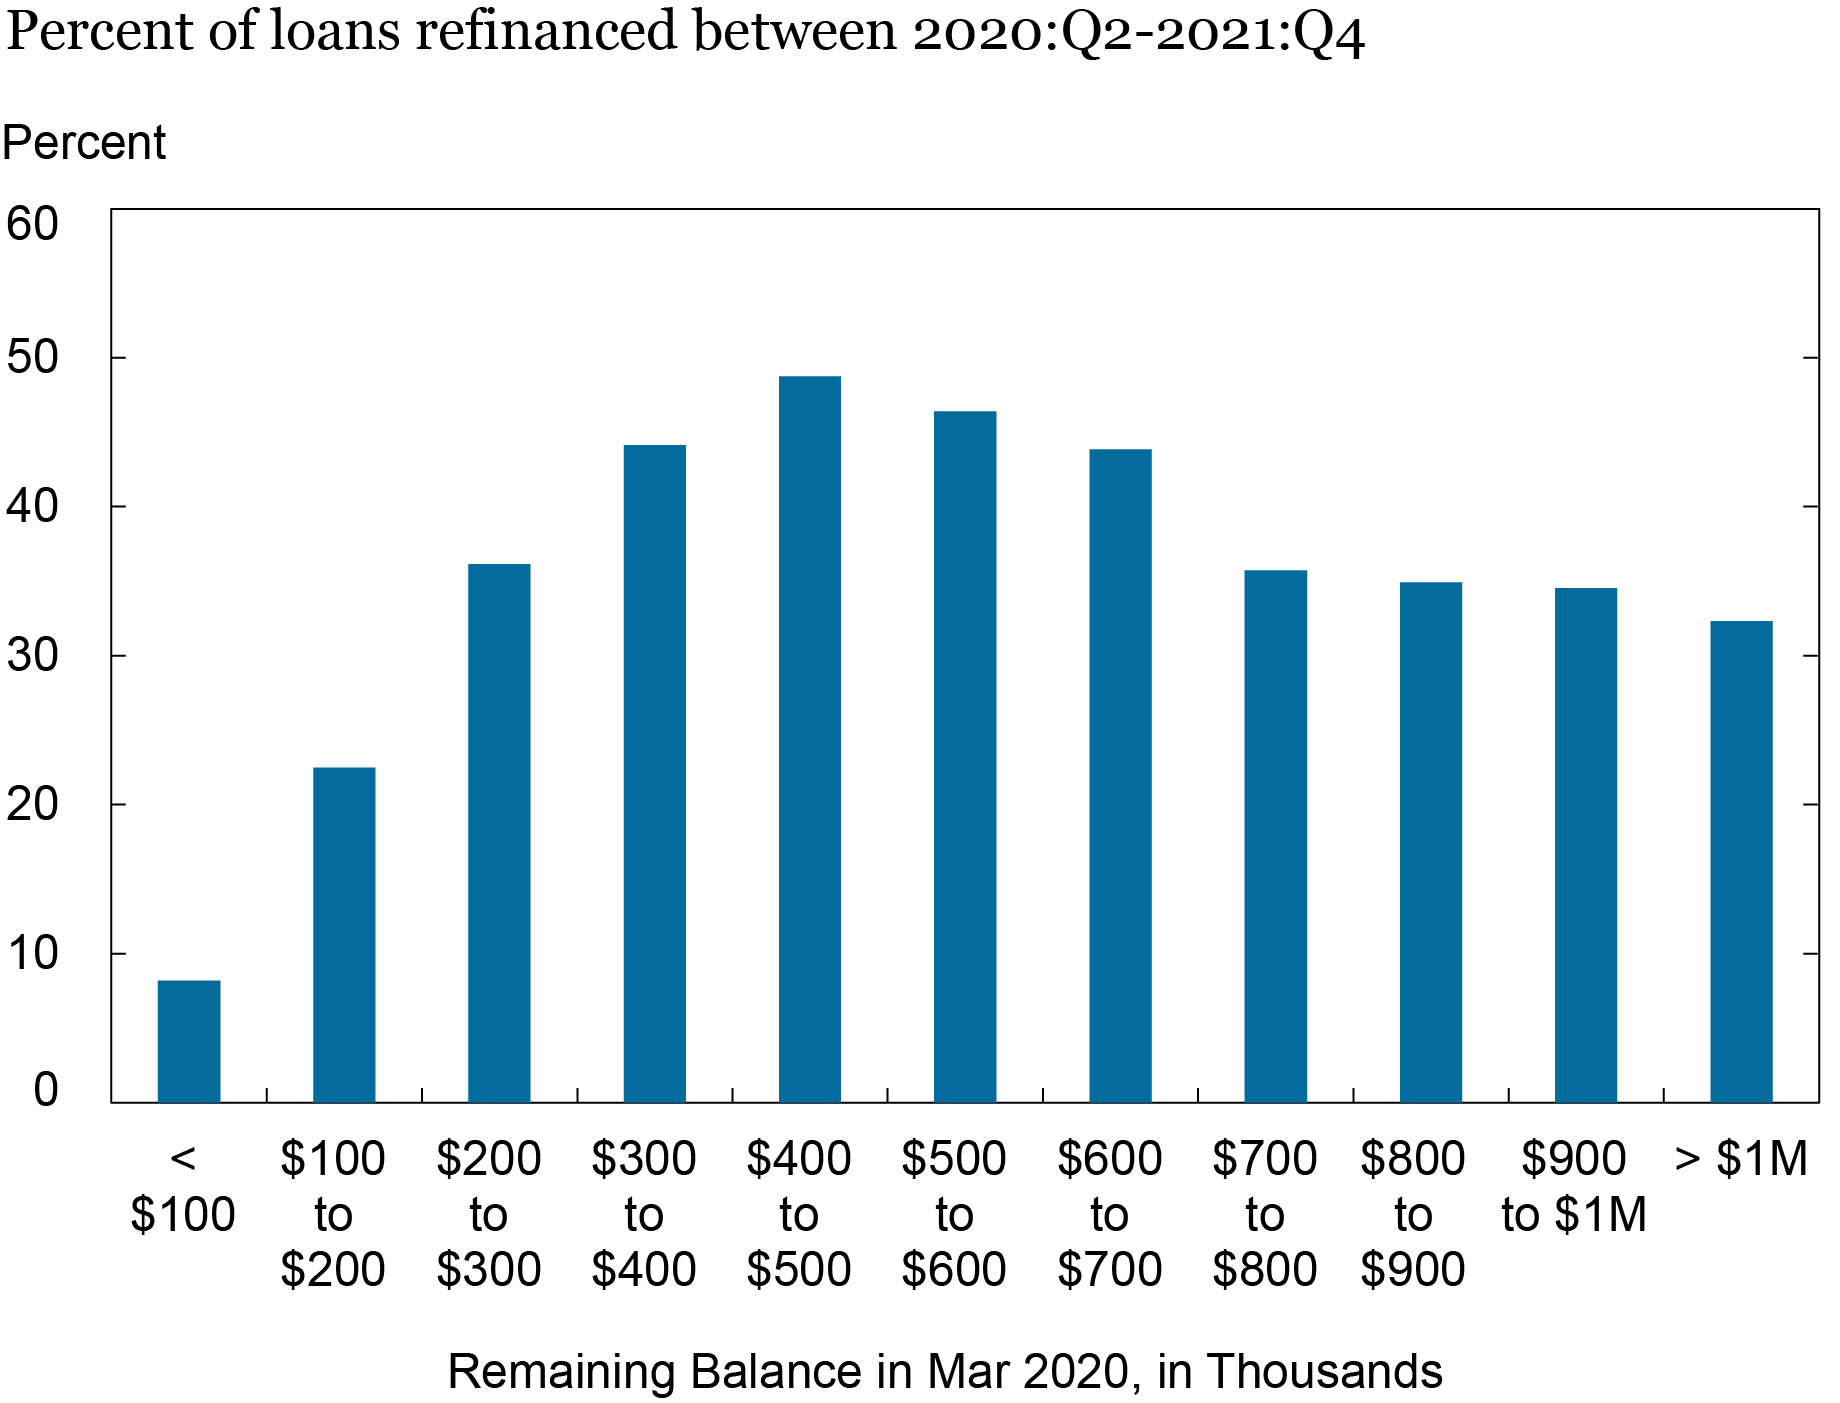
We expect a correlation between the remaining balances of mortgages and the propensity to refinance. It would make more sense to refinance if the balance is higher since the gain from refinancing is proportional to the balance refinanced. Indeed, this is what we illustrate in the chart below. Less than 10 percent of the mortgages with balances below $100,000 outstanding as of the first quarter of 2020 were subsequently refinanced, compared to nearly half of mortgages with balances between $400,000 and $500,000. Interestingly the propensity starts to decline after $500,000.
Smaller Balance Mortgages Were Less Likely to be Refinanced
With respect to the investor type of mortgages, we find that 25 percent of GSE mortgages were refinanced—a share identical between Fannie Mae and Freddie Mac. This similarity is perhaps not surprising given the potential substitution of assignment between GSEs. FHA borrowers were less likely to refinance at 22 percent, despite availability of FHA’s “streamline refinance” program. The most likely to refinance were VA mortgages. About 38 percent of VA mortgage accounts that were outstanding as of the first quarter of 2020 were refinanced by the end of 2021. The percentage of aggregate balances refinanced are higher since higher balance mortgages are more likely to refinance as shown above. Approximately 35 percent of the balances for GSE mortgages, 29 percent for FHA mortgages, 46 percent for VA mortgages, and 29 percent for other types were refinanced during this period.
Conclusion
In the end, fourteen million mortgages were refinanced during the COVID refinance boom, and these refinances will have effects on the mortgage market for years to come. Many borrowers who refinanced during the boom have improved either their cash flow, through a reduction in payments on their existing properties, or their liquidity by extracting equity from those properties. Approximately five million borrowers extracted a total of $430 billion in home equity from their refinancing. Meanwhile, nine million refinanced their loans without equity extraction and lowered their monthly payments, resulting in an aggregate reduction of $24 billion annually in their annual housing costs. The end of the most recent exceptionally low interest rate period leaves homeowners somewhat disincentivized to sell or change properties: Owners now looking to move will face increased borrowing costs and higher prices, with current home prices being more than 36 percent higher than they had been pre-pandemic. The improved cash flow generated by the recent refinance boom will potentially provide significant support to future consumption.

Andrew F. Haughwout is director of Household and Public Policy Research in the Federal Reserve Bank of New York’s Research and Statistics Group.

Donghoon Lee is an economic research advisor in Consumer Behavior Studies in the Federal Reserve Bank of New York’s Research and Statistics Group.

Daniel Mangrum is a research economist in Household and Public Policy Research in the Federal Reserve Bank of New York’s Research and Statistics Group.

Joelle Scally is a senior data strategist in the Federal Reserve Bank of New York’s Research and Statistics Group.

Wilbert van der Klaauw is an economic research advisor on Household and Public Policy Research in the Federal Reserve Bank of New York’s Research and Statistics Group.
How to cite this post:
Andrew Haughwout, Donghoon Lee, Daniel Mangrum, Joelle Scally, and Wilbert van der Klaauw, “The Great Pandemic Mortgage Refinance Boom,” Federal Reserve Bank of New York Liberty Street Economics, May 15, 2023, https://libertystreeteconomics.newyorkfed.org/2023/05/the-great-pandemic-mortgage-refinance-boom/
BibTeX: View |


Disclaimer
The views expressed in this post are those of the author(s) and do not necessarily reflect the position of the Federal Reserve Bank of New York or the Federal Reserve System. Any errors or omissions are the responsibility of the author(s).
 RSS Feed
 Follow Liberty Street Economics
It would be interesting to know who provided all this very low interest debt, and terms (fixed/variable rates) and maturities, 1-,15,30 year etc)